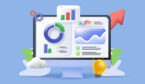


What is a Dashboard?
A dashboard in a call centre/BPO is a visual tool used to monitor and display key performance indicators (KPIs) and real-time data related to call centre operations.
It provides managers and agents with an at-a-glance view of how the call centre is performing, helping to manage daily operations, identify issues, and make data-driven decisions to improve efficiency and customer service.
A call centre dashboard will usually contain Call Volume, Average Handle Time, Agent Performance Metrics, Real-Time Alerts and Notifications, Call Wait Times and others.
| Sources of Data | Data Type |
|---|---|
| Workforce Management (WFM) | Agent Occupancy and Performance |
| Interactive Voice Response (IVR) | Customer Needs |
| Automatic Call Distributor (ACD) | Call Volume, Queue Length, Service Level |
| Customer Relationship Management (CRM) | Customer Satisfaction, First Contact Resolution |
Why are Dashboards Used in a Contact Centre
Dashboards, used by contact centres, aggregate information and enable planners to make key decisions moment-to-moment. They can also notify users of predetermined conditions, such as a certain volume of incoming calls.
Live conditions are compared against the benchmark, making it much easier to judge whether or not performance levels are on target.
The dashboard system can also pre-empt problems created by a variety of factors too diverse to be obvious to the user.
For example, a range of staff absences for training, sickness and breaks may coincide with an anticipated period of peak contact volume.
Information can also be broken down for managers to compare the performance of teams or departments more easily.
This will help to establish whether problems that emerge are the result of process issues or a single malfunctioning unit.
Customising Dashboard Views for Different Roles
Different employees have access to different information based on their role. A floor manager will usually see data that relates to staffing and SLA adherence. Frontline agents are more likely to need information on their personal performance or details about their current customer.
Whether frontline agents see traffic figures depends on how the contact centre expects agents to react to changes in circumstance.
For some centres, the emphasis is placed on delivering a certain quality of service with total consistency at all times. In this case, there is little benefit to be gained from showing agents information about incoming calls or call wait times.
Other centres do expect their agents to adapt to change. Agents may be encouraged to sacrifice up-selling opportunities in order to finish calls faster, so it may help to include traffic data on their individual dashboards.
The downside to this is that it can be dispiriting for agents to know that there is no end in sight for a particularly busy patch.
As a minimum, most dashboards show agents’ average performance levels. This can help them to understand their strengths and areas for development, while allowing them to compare how their KPIs rate against those of their colleagues.
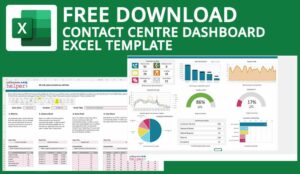
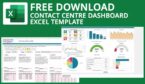
Free Dashboard Template Excel
If you’re looking for a dashboard template to use now, we have a free excel download to get you started.
Explore more free dashboards and templates to use in your contact centre here:
- How to Create a Customer Balanced Scorecard – with Template and Examples
- Excel Schedule Adherence Template – Free Download
- Monthly Forecasting Excel Spreadsheet Template
Author: Jonty Pearce
Reviewed by: Hannah Swankie
Published On: 6th Jan 2017 - Last modified: 22nd Jul 2026
Read more about - Expert Insights, Terminology