


Charles Watson offers his advice for overcoming one of the biggest challenges in contact centres today: getting forecasting and planning right.
Contact Centre Forecasting Methods and Tips
For anyone just getting started in forecasting for contact centres, it can be a real challenge. As you build out forecasting and planning, the expectations start to grow. People want more.
Whether it’s a stricter forecast accuracy target or moving to measuring at smaller time periods (e.g. from monthly accuracy to daily accuracy), as your operation matures, the expectations will grow.
Let’s walk through some tips for getting started in contact centre planning. The first tip, regardless where you are on your journey, is to have a clear objective. It’s never forecasting just for forecasting’s sake.
Monthly Forecasting
When you’re just getting started, the objective should be to give the operations “directionally correct” information.
What does that mean?
Well, it means you don’t spend a year trying to build a super-accurate forecast. You can get there over time. Instead, you focus on what you can build quickly and provide some insights into how many FTE (Full Time Equivalents) you need compared to how many FTE you have or plan to have.
An FTE is the equivalent of one person working full time. The actual number of hours may vary by region. In the US, an FTE is 40 hours per week. The gap between what you have and and what you need is what the operation needs to solve for.
Your monthly forecast should drive your hiring and staffing plan. This is the goal of this process. If your monthly forecast doesn’t ultimately position you to feed into a hiring plan, then it’s missing the mark.
Planning Long-Term Demand
To determine how many FTE you require, you’ll need to pull together a forecast for workload and staffing.
Workload is simply the contact volume multiplied by the contact average handle time. Both of these forecasts will start with historical data and layer in business intelligence. Start by selecting a staff group to forecast.
Gather as much historical data as you can for that group. Ideally, go back 36 months, so you have a good view of how volume and handle times have trended over time, and to get a sense of seasonality.
The easiest way to start is to identify the growth year over year to establish where your volume should be this year. Here is a sample data set for us to apply a simple growth factor to.
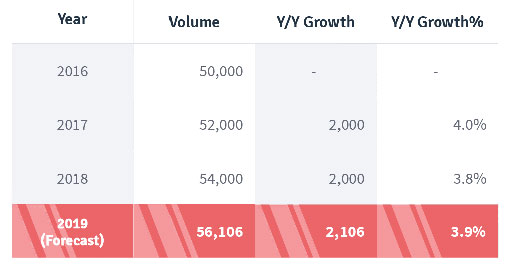
Table 1: YoY growth in contact volume
Since your growth rate was 4% one year and 3.8% the next year, the simplest approach is to just take the average growth rate, which is 3.9% and apply that to the previous year to forecast the next year.
In the example above, that would have us adding 2,106 to the volume we saw in 2018, which gets us to a forecast for 2019 of 56,106 contacts.
To shape this into a monthly forecast, take the average volume per month to determine what % of the year’s contacts come in each month.
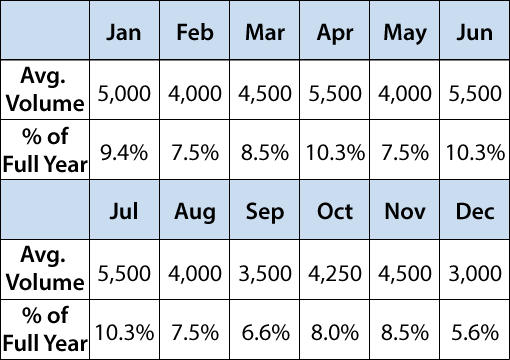
Table 2: Average contact volume per month based on sample data
For the 2019 forecast, you would then just multiply the percent for each month by the total volume for the year.
Assuming your full-year forecast is 56,106, your monthly volumes would look like this:
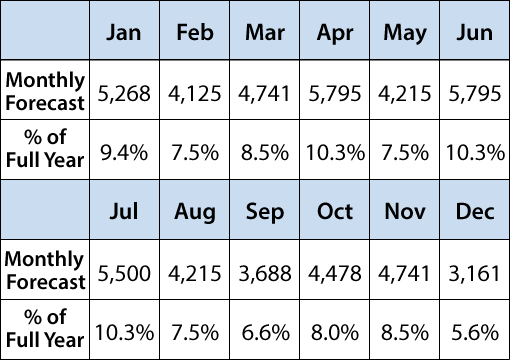
Table 3: Forecast contact volume per month based on sample data
So this is a simple way to quickly get a forecast that will provide some high-level direction to your operations.
You can repeat this same process with handle time, but since you are working with averages, you’ll apply the percentage to the average handle time for the full year, instead of the total like you did for the volume.
You can also repeat this same process for weekly or daily forecasts. I’ll show you a few ways do the more granular forecasting.
Weekly and Daily Forecasting
There are a few ways to get to a daily and weekly forecast. First, start with the objective.
The objective of weekly and daily forecasts is to determine where you schedule your staff. One question I’m often asked is whether your daily and monthly forecasts have to match exactly.
The answer is no.
Your monthly forecasts are done farther in advance with less accurate information. As you get closer to the date, you should have updated business intelligence to help improve the accuracy of your forecast.
So if you get to a week and the forecast is simply a mathematical breakout of the monthly forecast, you are missing some opportunities.
You should absolutely bridge your monthly (long-term) and weekly (short-term) forecasts. Let’s say you’re looking 3 months out.
You have a monthly forecast and you may have a weekly forecast for that same timeframe. This far out, it makes sense for them to match. But as you get closer, 3–6 weeks, you should adjust your weekly forecast so you can fine-tune staffing.
As you have new information to change your short-term forecast, you should document that change and why.
Here is an example:
Your forecast 3 months from now assumes your call volume will grow 10% year over year, which is consistent with how you’ve been performing.
When you get a month out, you learn there is a change in the billing process that will likely result in customers calling in to ask questions.
In this case, you will want to increase your weekly forecast and document the reason for the change. By documenting, not only do you make it clear why a change was made, but you also can then test your assumption against the actual.
If you thought the extra billing calls would drive an added 5% in volume and compare that to what actually happened, you can use this the next time there is a billing change to have an even more accurate forecast.
There are two methods to building your initial weekly and daily forecasts:
1) Bottom up
or
2) Distribute the month
When you do a Bottom up, you’re actually forecasting for each day, and rolling that up to the month.
So essentially your daily forecast turns into a monthly forecast. Distributing the month is the exact opposite. Create the monthly forecast then distribute it using Week of Month or Day of Month factors.
Let’s look at each:
Bottom-Up Approach in Forecasting
When you start with the daily forecast, you actually take the same approach. Instead of applying the year-over-year growth factor to each month, you apply it to each day of the previous year’s actual volume.
With this method, your baseline forecast will match each date of the previous year (e.g. Jan 23rd 2018 and Jan 23rd 2019). Once you’ve done this, before you roll it up to the monthly totals, you need to adjust for holidays.
Some holidays fall on the same date (Christmas), but many fall on a Monday so the date will change each year. To adjust your holidays, look at the day-of-week distribution for the week before, during and after the holiday last year.
You want to see how the volume trended by day of week and apply that factor to the total volumes for the weeks around the holiday. In many cases, you may only have volume impacted on the actual week of the holiday.
If that’s the case, you only need to work with that week’s data.
I recommend the first time you do the holiday factors that you look at all 3 weeks, then determine what data you actually need. Save this trend and you can use it again for future years.
Once you have a solid daily forecast, you can simply roll that up to the 52 weeks of the year, or the 12 months of the year to get a weekly and monthly forecast.
Distribute the Month Method
This is the method more commonly used because it’s generally easier to work with 12 data points (monthly volume) vs. 365 data points (daily volume).
Also, most contact centres have workforce management technology that stores historical daily volume distribution and uses that model to break out the monthly volume into daily volume.
When using this method, you create the monthly forecast as we did at the start of this blog. Once you have the monthly volumes, you use the historical distribution of volume by day of month.
For example, if Jan 1st is generally 2% of your January volume, and your January forecast is for 10,000 calls, then your forecast for January 1st is 200 calls.
Of course, you need to adjust for holidays as we did in the Bottom-Up scenario. This is an important step that can easily get overlooked if you don’t have a checklist to make sure you know all of the holidays that have different volume distributions.
For those who take contacts from different markets, keep in mind your callers may live in a country (or state) that has different holidays than your contact centre taking the calls. So you need to do some research.
Business Intelligence in Forecasting
It can be very beneficial to layer in business intelligence over any data-driven forecast.
Business Intelligence is any information you can get that explains why the future will be different from the past.
The billing process example I used above is pure business intelligence. Other examples would be marketing campaigns, new product launches, changes in policies, or changes to online self-service.
There are dozens of things that can change going forward. You need to be in the loop on all of them.
A best practice here is to set up weekly and monthly meetings with various departments that may impact volume. A strategic monthly meeting, and a more tactical weekly meeting.
In the monthly meeting, you want groups like marketing, sales, operations, billing, etc. to participate.
In the session, you should cover a list of things you know have impacted volumes in the past to see if they have any similar in the future and ask them if there is anything else that they know of that may impact volumes.
The reason why it’s good to come in with a list of potential impact areas is that it helps ensure you’re not just relying on what they think may impact volume.
In your weekly tactical meeting, it’s best to recap the expected impacts from the monthly meeting and see if anything has changed from your previous assumptions.
Additionally, you’ll want to cover anything shorter term that may impact volumes. One example here is recontact volume.
Let’s say you’ve missed service level for the past few weeks and expect to continue to miss. If your abandon rate is high, it will likely cause people to call back, which artificially inflates your contact volume.
Ultimately, the recontact volume isn’t incremental, but from a service level management perspective, you’ll have to assume the inflated contact volume in your forecast.
The people calling back likely missed service level on the first call, and may miss again on the second call.
Another reason you want to layer in this effect is that when you’re building out the forecast for next year, you will need to back out this extra volume from the actual data to normalise it, assuming you’re staffed properly next year.
Author: injixo
Published On: 31st May 2018 - Last modified: 26th Feb 2025
Read more about - Expert Insights, Forecasting, Peopleware