


Accurate forecasting is essential for effective contact centre planning, but measuring forecast accuracy is just as important as making the predictions themselves.
As a result one of the most important and challenging jobs in the contact centre is forecasting demand. Forecasting models require constant refinement, so it’s up the planners to evaluate how accurate their predictions have been.
At face value, forecast accuracy might seem simple to calculate – were there as many contacts as predicted? On closer inspection, however, it’s clear that businesses also need to understand exactly when contacts were made, and whether the contact centre was prepared for them.
Three Methods for Forecasting Accuracy
There are three common methods for calculating forecast accuracy in the contact centre. These are:
Video: Methods to Calculate Forecast Accuracy
We discuss each of the three methods in detail in this article, but take a look at this eight minute video guide narrated by Penny Reynolds of The Contact Centre School that goes through the basics of each method:
There is lots of great information in the video and we explain each of these methods below, after introducing you to a term called “actual volume”.
Knowing what we mean by “actual volume”, is a key part of your forecast accuracy calculations.
Find more key WFM advice from Penny Reynolds, in our article: The Power of One
What Is ‘Actual Volume’?
First, we need to understand what we mean when discussing contact volume. It’s another question that seems simple at first but that requires some thought.
If we take actual volume to mean ‘the number of calls answered’ we face a very big potential problem – we won’t count the calls that we didn’t answer.
When incoming volume is greater than call handling capacity, some calls will not be answered. If they’re not answered, and therefore not counted, we end up with an unrealistic idea of total volume.
For example, imagine a contact centre that forecasts 2,000 contacts on a day when 3,000 customers are going to call. If the centre runs at maximum occupancy all day and answers 2,400 calls, the forecast will only appear to be off by 400.
For this reason, most planners evaluate forecast accuracy based on calls offered rather than calls answered. Bear in mind that this approach is also imperfect, because it counts each repeat unsuccessful contact attempt separately, inflating total volume.
It is the ‘less bad’ approach, though, so we will assume that ‘calls offered’ is the measure of actual volume.
Find out more about the basics of forecasting in our article: A Guide to Workforce Forecasting in the Contact Centre
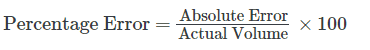
1. The Forecast Accuracy Formula (Percentage Error)
One simple approach that many forecasters use to measure forecast accuracy is a technique called “Percent Difference” or “Percentage Error”. This is simply the difference between the actual volume and the forecast volume expressed as a percentage.
The Forecast Accuracy Formula is as follows:
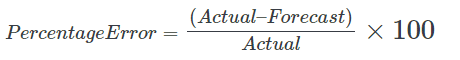
This formula to calculate percentage error involves first taking the ‘Forecast’ from the ‘Actual’ and then dividing the result by the ‘Actual’, before multiplying by 100 to get the percentage.
Forecast Accuracy (%) = (Actual Value – Forecast Value) ÷ (Actual Value) × 100
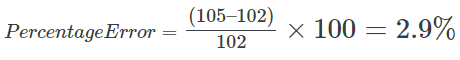
We can use this formula for the first interval in the example below, where actual volume is 105 and the forecast was 102.
| Interval | Calls Offered | Forecast | Error | % Difference |
|---|---|---|---|---|
| 8:00 am – 8:30 am | 105 | 102 | 3 | 2.90% |
| 8:30 am – 9:00 am | 128 | 135 | -7 | -5.30% |
| 9:00 am – 9:30 am | 136 | 138 | -2 | -1.50% |
This is a useful and reliable way of measuring forecast error within an interval. However, forecasters rarely need to report on single intervals, focusing instead on forecast accuracy over long periods – but this is not the best thing to do.
The Wrong Way: Measuring Forecast Accuracy Across the Day
The wrong way to calculate forecast accuracy is to measure across the entire day, without taking intervals into consideration.
Take the data in the table below as an example:
| Interval | Calls Offered | Forecast | Absolute Error | % Difference |
|---|---|---|---|---|
| 8:00 am – 8:30 am | 105 | 102 | 3 | 2.9 |
| 8:30 am – 9:00 am | 128 | 135 | 7 | 5.3 |
| 9:00 am – 9:30 am | 136 | 138 | 2 | 1.5 |
| 9:30 am – 10:00 am | 167 | 145 | 22 | 14.1 |
| 10:00 am – 10:30 am | 197 | 172 | 25 | 13.6 |
| 10:30 am – 11:00 am | 213 | 245 | 32 | 13.9 |
| 11:00 am – 11:30 am | 220 | 222 | 2 | 0.9 |
| 11:30 am – 12:00 am | 194 | 203 | 9 | 4.5 |
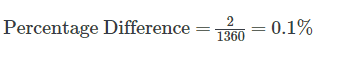
| Total | 1360 | 1362 | 2 | 0.1 |
If we use the Percentage Difference method across the whole day, we can calculate the percent difference to be 0.1%
Sounds good, right? But if we look at the individual intervals throughout the day, we can see a much wider variation.
So, while this result might be what contact centres wants to see, it does not represent the facts.
The Better Way: Measuring Forecast Accuracy at Hourly Intervals
Instead of breaking percent difference up across the day, it is better to include the results across intervals in your calculations, for a more reliable result.
So, you may decide to divide your data into hourly intervals. An interval is a fixed unit of time, sometimes referred to as a “reporting period”.
| Interval | Calls Offered | Forecast | Absolute Error | % Difference |
|---|---|---|---|---|
| 8:00 am – 9:00 am | 233 | 237 | 4 | 1.7 |
| 9:00 am – 10:00 am | 303 | 283 | 20 | 6.8 |
| 10:00 am – 11:00 am | 410 | 417 | 7 | 7 |
| 11:00 am – 12:00 am | 414 | 425 | 11 | 2.6 |
Using the same data as in the calculation above, which found the forecast accuracy to be 0.1%, let’s take a look at the percent difference for the day when taking hourly intervals into account.
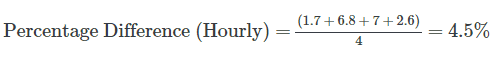
Already the forecast accuracy (percent difference) has jumped up from 0.1% to 4.5%.
The Correct Way: Measuring Forecast Accuracy at 15 Minute Intervals
Forecasters can generate very different results based on the intervals that they measure.
Across the industry, intervals of fifteen minutes are generally seen as the most desirable because they represent the most granular data it is practical to measure.
Intervals of thirty minutes are also common, especially in smaller contact centres that have more volatile contact patterns.
| Interval | Calls Offered | Forecast | Absolute Error | % Difference |
|---|---|---|---|---|
| 8:00 am – 8:30 am | 105 | 102 | 3 | 2.9 |
| 8:30 am – 9:00 am | 128 | 135 | 7 | 5.3 |
| 9:00 am – 9:30 am | 136 | 138 | 2 | 1.5 |
| 9:30 am – 10:00 am | 167 | 145 | 22 | 14.1 |
| 10:00 am – 10:30 am | 197 | 172 | 25 | 13.6 |
| 10:30 am – 11:00 am | 213 | 245 | 32 | 13.9 |
| 11:00 am – 11:30 am | 220 | 222 | 2 | 0.9 |
| 11:30 am – 12:00 am | 194 | 203 | 9 | 4.5 |
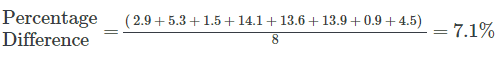
Using the data set above, we can calculate our forecast accuracy to be 7.1% using the Percentage Difference method across half hourly intervals:
Based on this, it seems obvious that the smallest possible interval gives us the most reliable forecast accuracy, but this is not necessarily the case.
We’ve already mentioned small contact centres, which tend to have difficulty with short intervals owing to the natural volatility in their occupancy rates.
There may also be organic variability in volume during the hour. Some research has outlined a calling pattern where 40% of traffic for the hour occurs within the first fifteen minutes. The suggestion is that customers are prone to scheduling calls for the start of an hour.
This will occur uniformly in every contact centre, but it is worth investigating when unexplained variances persist in forecasts.
Finally, there is the issue of overhang.
What Is Overhang?
As call volume begins to increase, there is a gradual rise in occupancy. On the other side of this, when volume starts to decrease, there is a gradual fall in occupancy. Overhang refers to the calls which begin in one interval but which are still live into the next interval.
This means that contact centres should avoid measuring intervals that are less than double their AHT – otherwise they will consistently have too many agents engaged in calls from the previous interval to handle calls in the new interval.
However accurate the forecast may have been on paper, it will be clear that there are too many incoming calls for the available staff to handle.
So, while a fifteen-minute interval is preferable for some medium or large contact centres, that’s only the case when their AHT is below seven and a half minutes.
For more key WFM considerations, like overhang, be sure to read our article: 10 Things You Need When Calculating How Many Contact Centre Advisors You Need
Mean Absolute Percent Error
The Mean Absolute Percent Error (MAPE) measures the error as a percentage of the actual value, which is calls offered.
To begin, we simply calculate the percent error of each interval.
We then calculate the mean average of the percent errors for the data set to get the MAPE.
| Interval | Calls Offered | Forecast | Absolute Error | % Difference |
|---|---|---|---|---|
| 8:00 am – 8:30 am | 105 | 102 | 3 | 2.9 |
| 8:30 am – 9:00 am | 128 | 135 | 7 | 5.3 |
| 9:00 am – 9:30 am | 136 | 138 | 2 | 1.5 |
| 9:30 am – 10:00 am | 167 | 145 | 22 | 14.1 |
| 10:00 am – 10:30 am | 197 | 172 | 25 | 13.6 |
| 10:30 am – 11:00 am | 213 | 245 | 32 | 13.9 |
| 11:00 am – 11:30 am | 220 | 222 | 2 | 0.9 |
| 11:30 am – 12:00 am | 194 | 203 | 9 | 4.5 |
| Total | 1360 | 1362 | 2 | 0.1 |
| MAPE | 7.03 | |||
MAPE is a useful way to communicate forecasting data across a business, because the result is expressed in percentage terms which are more likely to be meaningful than an actual volume figure.
Because it’s a percentage, percent error is often confused with percent difference, which we used in the first example. To complicate matters, both calculations will often return the same result when the absolute error is small enough.
Using our first interval as an example, both the percent difference and the percent error are 2.9%. Of course, this does not mean they are interchangeable, and the larger the error or the data set, the greater the variance.
MAPE can be problematic for small contact centres because it is very sensitive to scale. While this is unlikely to be an issue for medium or large contact centres, MAPE can return unreliable data for contact centres with limited forecasting data to feed in.
Mean Absolute Deviation
Mean Absolute Deviation (MAD) is one possible alternative for small contact centres that have difficulty using MAPE. It’s simply the mean average of the errors (or ‘deviations’) for the data set.
Notice that we are still using the absolute error here, which is important for returning meaningful results.
| Interval | Calls Offered | Forecast | Absolute Error |
|---|---|---|---|
| 8:00 am – 8:30 am | 105 | 102 | 3 |
| 8:30 am – 9:00 am | 128 | 135 | 7 |
| 9:00 am – 9:30 am | 136 | 138 | 2 |
| 9:30 am – 10:00 am | 167 | 145 | 22 |
| 10:00 am – 10:30 am | 197 | 172 | 25 |
| 10:30 am – 11:00 am | 213 | 245 | 32 |
| 11:00 am – 11:30 am | 220 | 222 | 2 |
| 11:30 am – 12:00 am | 194 | 203 | 9 |
| Total | 1360 | 1362 | 2 |
| MAD | 12.75 | ||
MAD is more robust than MAPE when it comes to very small data sets, although it returns data in terms of actual values rather than a percentage.
This should be fine for the forecaster themselves, but it can make communicating results to other areas of business trickier.
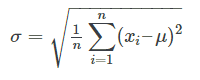
2. The Forecast Accuracy Formula for Standard Deviation
This measure is generally recognised as one of the most useful tools that forecasters have at their disposal. It represents the spread of the data, standardising the deviation (error) from the apparent norm.
Unlike the other measures we have looked at, Standard Deviation is a reasonably complex process to perform manually, making it prone to error. In most cases, Standard Deviation is calculated through WFM tools or an Excel spreadsheet.
It is worth noting that there are variations on the standard deviation formula, each useful for different kinds of data sets. In forecasting accuracy we are most interested in ‘population standard deviation’.
This is the equation for population standard deviation:
[You can look at how to perform this Excel function here.]
There are five steps to calculating Standard Deviation:
- Find the mean of the data set
- Find the distance from each data point to the mean, and square the result
- Find the sum of those values
- Divide the sum by the number of data points
- Take the square root of that answer
Our data set is the errors rather than the absolute errors, meaning that we will be using positive and negative numbers.
First we find the mean of our data:
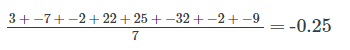
Then we find the distance from each data point to the mean and square it:
| Error | Distance from Mean | x2 |
|---|---|---|
| 3 | 3.25 | 10.56 |
| -7 | 6.75 | 45.56 |
| -2 | 1.75 | 3.06 |
| 22 | 22.25 | 495.06 |
| 25 | 25.25 | 637.56 |
| -32 | 31.75 | 1008.06 |
| -2 | 1.75 | 3.06 |
| -9 | 8.75 | 76.56 |
| Sum | 2279.48 |
Next, we find the sum of the squared values, which is 2279.48, and divide it by the number of data points, getting 284.94
Finally, we get our result by finding the square root of that value, which is 16.88. This is our Standard Deviation for the data set.
There is another useful application of Standard Deviation. Rather than using errors as the data set, forecasters can use the actual contact volumes. The Standard Deviation figure result will be a representation of the general level of volatility in call volume over time.
This can be used to inform the amount of variability the forecasters need to build into their scheduling. And, if volatility is high, this can also be the figure they use to explain why there are forecasting errors.
3. The Forecast Accuracy Formula for Correlation Coefficient
When a forecast contains errors, it is important to establish what other variables were linked to the unexpected increase or decrease in contact volume. Calculating the correlation coefficient of data sets is an effective way to this.
The correlation coefficient indicates the degree to which the movement of one variable affects the movement of another variable. If x goes up, how does that affect y?
The result is a number between -1 and +1 indicating something between a strong positive correlation and a strong negative correlation. This is the formula for correlation coefficient:
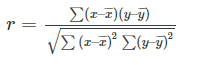
This is another calculation that forecasters are very unlikely to perform manually due to a very large capacity for error.
Here’s an overview of how to reach the correlation coefficient for any data sets:
- Define two data sets, in this case the contact volume for two separate days. We’ll call them x and y
- Find the mean of x and the mean of y
- Subtract the mean of x from every x value (a), and the mean of y from every y value (b)
- Calculate a × b, a² and b² for every value
- Sum up a × b, as well as a² and b²
- Divide the sum of a × b by the square root of [(sum of a²) × (sum of b²)]
[You can read how to perform this function on Excel here.]
Alternatively, have a look at this Free Monthly Forecasting Excel Spreadsheet.
With thanks to the following people for sharing their thoughts and experience for this article:
- Christine (Stubbs) Reid-Williams, WFM Contact Centre Consultant at Maintel
- Charles Adams, Customer Service Operations Manager at Ordnance Survey
- Penny Reynolds, Founding Partner at the Call Center School
If you want to read more about forecasting in the contact centre, look at these articles:
- Workforce Management Reference Guide
- How to Forecast and Plan for Live Chat
- 50 Expert Tips to Improve Contact Centre WFM
- 50 MORE Expert Tips to Improve Contact Centre WFM
Author: Jonty Pearce
Reviewed by: Megan Jones
Published On: 16th Aug 2017 - Last modified: 13th Aug 2025
Read more about - Workforce Planning, Charles Adams, Christine Reid-Williams, Forecasting, How to Calculate, Penny Reynolds, Peopleware, Workforce Management (WFM), Workforce Planning