


Forecasting contact volumes is a core challenge for any contact centre, but what happens when you don’t have years of historical data to rely on?
Many organisations face this exact dilemma, whether they are launching a new service, entering a fast-growing market, or simply dealing with incomplete records, uncertainty around contact patterns can make planning difficult.
In these situations, the data needed to produce accurate forecasts may be incomplete, unavailable, or entirely non-existent.
Before we explore strategies to tackle these challenges, it’s important to understand the two key ingredients of forecasting with minimal data: the high-level forecast and low-level plan.
The High-Level Forecast and the Low-Level Plan
In order to generate a forecast with limited data, you first need to split the forecast into two parts – the high-level forecast and the low-level plan.
The High-Level Forecast
This is the top-level forecast that details how many contacts you expect to get across the coming year and an estimate of how this is broken down month by month.
The Low-Level Plan
This takes a high-level forecast and breaks it down into a weekly, daily or hourly (or 15-minute) interval and then works out the number of staff needed. This is typically done on a much shorter horizon.
How Much Data Do You Need to Create an Accurate Forecast?
To make a good forecast you need three years of data or more, and to make a great forecast, you need five years.
Why Do I Need Three Years of Data?
Almost all contact centre arrival patterns are seasonal. Call volumes vary on a month-by-month basis, as well as on a yearly basis. In fact, you should expect weekly variations also.
So, to make a good forecast, you need to separate your trends and seasonality.
However, your arrival data will also include variations in demand caused by factors such as external events, marketing campaigns and the like that may not happen every year.
So, if there was a spike say in March of the first year but not in the second year, you would need a third year to identify which year was accurate.
Three Scenarios for Forecasting with Limited Data
There are numerous situations where a contact centre might have an insufficient amount of data to create the ideal forecast.
It is important to note that forecasting with minimal data relies heavily on high-level guestimates, however, it is still possible to achieve an accurate end result.
Once you have created your forecast of contact volumes, you need to align your demand and forecast staffing levels. To do this, you need to use an Erlang Calculator.
To help get you started, we will take a look at three of these situations:
- Forecasting Without Historical Data
- Forecasting With Incomplete (or Limited) Information
- Forecasting a New Service / Channel in a Well-Established Organisation
1. Forecasting Without Historical Data
When forecasting for the contact centre of a start-up organisation, there are two key stages in creating your initial forecasts. These are: to forecast based on a financial plan and to forecast by comparison.
Option 1 – Forecasting Based on a Financial Plan
You may not know what your contact demand is, but you may be able to work this out from your financial plan.
For example, let’s take a typical year:
To estimate how many calls you will likely receive in this way requires knowledge of the number of products that you are predicted to sell.
You can acquire knowledge of how many products you are likely to sell through revenue forecasts from the wider business.
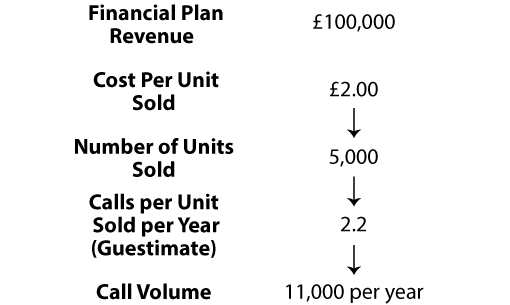
For example, if your business is predicted to generate £100,000 in revenue within the next year, work out how many sales would be needed to reach this figure.
Once you have this number, it is time to predict a revenue to contact ratio. This ratio predicts how many sales of a product/service will likely equate to one contact, which will vary greatly from industry to industry.
For example, a contact centre for a server software company is likely to receive many more support contacts per sale than one of a discount retailer. So, the server centre may receive ten contacts for every sale, while the discount retailer may get 2.2 contacts for every sale.
One way to help you estimate this ratio is to use the benchmarks set by other contact centres within the same field.
Then you can combine the number of products/services that you expect to sell – over the course of the year, for example – with your ratio to estimate how many contacts you will likely receive across the course of the year.
You can then use the revenue forecast to build up your call volumes.
Option 2 – Forecasting by Comparison
Once you have forecast the number of calls that you will likely receive in a year, you need to consider seasonality. After all, you won’t receive the same number of calls 365 days a year.
In fact, contact volumes can vary greatly, and to get an indicator for when contacts will arrive, month by month, day by day, and hour by hour, you need to visit other contact centres to estimate seasonality.
These contact centres need to be in your field, as different fields have different peak periods. For example, a retail contact centre will probably have a Christmas peak, while a insurance contact centre most likely won’t.
By making contact with other organisations, you may be able to use older call arrival patterns to give you a rough idea of the seasonality you can expect.
To do this, ask the contact centre that you visit to provide you with a data set like the one below. This will give you the percentage of the yearly contacts on a month-by-month basis.
| Month | Percentage of Yearly Contacts |
|---|---|
| January | 10% |
| February | 8% |
| March | 7% |
| April | 8% |
| May | 7% |
| June | 5% |
| July | 5% |
| August | 4% |
| September | 7% |
| October | 7% |
| November | 10% |
| December | 22% |
Then, multiply your projected number of yearly contacts by the percentage of contacts expected for each month. This will give you a forecast contact volume for each month of the year, otherwise known as the high-level forecast.
For example, if you expect 100,000 contacts a year and in January you expect 10% of this overall contact volume, your January forecast would be 10,000 contacts.
Generating the Low-Level Plan
Using either option one or two, you should have a data set of forecast monthly call volumes. These now need to be split into daily and half-hourly segments.
Step 1 – Splitting Monthly Call Volumes Into Daily Call Volumes
The next stage is to estimate the contact volumes on a day-by-day basis. But you can’t simply divide monthly call volumes by 28/30/31. This is because your contact centre could receive twice as many calls on an average Tuesday than it would on an average Friday.
So, find out from other contact centres the percentage of weekly traffic that they tend to receive on a day-by-day basis. This will help you to form a data set like the example below.
| Day | Percentage of Weekly Contacts |
|---|---|
| Monday | 16% |
| Tuesday | 22% |
| Wednesday | 17% |
| Thursday | 15% |
| Friday | 13% |
| Saturday | 10% |
| Sunday | 7% |
Once you have this information, split the monthly contact volume into weeks and then break these weekly forecast volumes into calls expected per day, by using information like the above.
For example, if you expect 2,500 calls in a week and you’re forecasting for a Monday which will likely receive 16% of that weekly call volume, expect 400 calls.
This is because 2,500 calls x 0.16 = 400 calls.
This is because 2,500 calls x 0.16 = 400 calls.
For this to work, you need to ensure that your contact centre is open on the same days of the week as the contact centre from which you receive this data. If your centre is Monday to Sunday, don’t take data from one that is only open from Monday to Friday.
Step 2 – A Daily Contact Arrival Pattern
Once you have a forecast number of calls for the day, it is time to split that number of calls across time intervals. Many contact centres choose to use intervals of half an hour.
So, the final piece of information that you should gather from the other contact centre is the percentage of daily contacts expected over each 30-minute period of the day. Take the table below as an example of what you are looking to collect.
| Time Intervals | Percentage of Calls |
|---|---|
| 08:30 | 0.37% |
| 09:00 | 4.66% |
| 09:30 | 4.05% |
| 10:00 | 5.52% |
| 10:30 | 4.30% |
| 11:00 | 6.13% |
| 11:30 | 5.77% |
| 12:00 | 8.83% |
| 12:30 | 5.77% |
| 13:00 | 7.12% |
| 13:30 | 5.52% |
| 14:00 | 6.01% |
| 14:30 | 5.40% |
| 15:00 | 6.38% |
| 15:30 | 6.99% |
| 16:00 | 6.63% |
| 16:30 | 6.01% |
| 17:00 | 4.42% |
| 17:30 | 0.12% |
By multiplying each percentage by the number of daily contacts expected, you can forecast the number of calls that you expect to receive at a half-hourly rate.
i.e. (1/percentage of daily calls in 30 min time period) x daily call volume
Once you have done so, you can create your very own call arrival pattern like the one below:
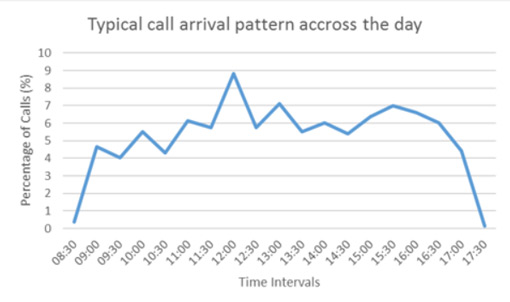
Having a call arrival pattern like this is great for scheduling advisors using the Erlang Calculator.
Remember, the only way that your prediction can be accurate is if the contact centre that you take the data from has the same opening hours as you plan to have.
To find out how to schedule advisors using a call arrival pattern, read our article: How to Work Out How Many Staff You Need in a Contact Centre
2. Forecasting With Incomplete (or Limited) Information
There are many reasons why the contact centre may have insufficient data for creating forecasts, just like the three below:
Computer Systems Not Producing Good Reports.
For example, some systems may only record the latest 12 months of data. These computer systems are not as detailed as some telephony systems, which provide you with 3+ years of history.
However, if your computer system only records 12 months of data, check to see if your telephone company has longer records of contact volumes (i.e. the number of calls that you have received). This could help to give you more data.
Outsourcers Not Being Good at Saving Data.
This can be a problem when a contact centre ends their outsourcing contract, as the outsourcer may be unable to provide them with the necessary data.
You’re New to the Job.
You may have just come into the company and may not be able to access the right information. In this case, you probably need to do more digging to find what information is available.
While these are common causes for having incomplete information, there could possibly be a great deal more that will leave long-standing contact centres with an insufficient amount of data for forecasting.
But there are different levels on “insufficient data” that long-standing contact centres may have.
So, let’s first investigate how a long-standing contact centre can forecast with no recorded contact volumes, before assessing how much data you need to create an accurate forecast.
Forecasting With No Recorded Contact Volumes
If you don’t have access to contact volume history, forecasts can be created using financial data. This financial data will tell you the number of products sold on a monthly basis. Ideally, you would like to acquire five years of data.
Then, as Prasanth Nambiar, a workforce management specialist at Facebook, recommends: “Create a ratio between total numbers of customers per month versus total number of calls per customers per month.”
“If this information is not available then try to get it from other companies, similar products or ask the business itself.”
With this financial data, you can build a model that creates a guesstimate of past contact volumes. This model will work on the basis that a certain number of products sold will equate to a certain number of calls.
By using this model, you will be able to track seasonality at a monthly rate and estimate contacts on an annual basis.
Unfortunately, there is no way to forecast with no available data without making high-level guesstimates.
But, as Prasanth says, you can “go back to the business and validate all these assumptions.”
“At the end of the day, the numbers you give to the business as a forecast are not ‘your own’, per se, but their own business knowledge, based on their own business plan and business targets.”
You would then forecast as if you had a full set of data. With a complete set of data, most contact centres would choose to forecast by using a technique called exponential smoothing.
How much Historical Data is Required for a Monthly Forecast
The absolute minimum amount of data that you need to create a monthly centre forecast is 13 months of data, but it will not be very good.
It is generally said that three years of data is needed to work out both trend and also seasonality. The ideal amount is five years.
However, it may be possible to create a forecast with as little as
As you can see from the graph below…
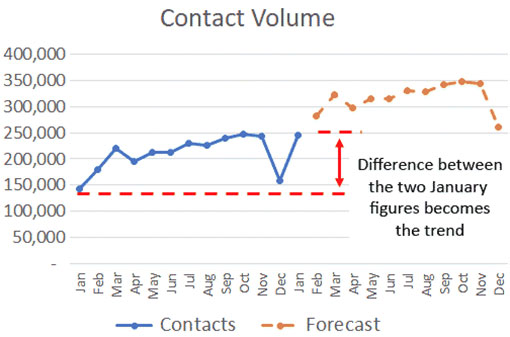
Once you have calculated this trend, you would then add seasonality.
However, a forecast that uses five years’ worth of data will most likely provide more accurate results, as you can then use exponential smoothing.
This is especially true for contact centres that have peaks every four years for events like the World Cup and the Olympics. A moving average, which only includes the past three years’ data in its calculations, may not be sufficient for such contact centres.
3. Forecasting a New Service / Channel in a Well-Established Organisation
It is not just forecasting for a new channel that can be difficult for a contact centre, but forecasting for the launch of a new product/service can be equally challenging.
There is little in the way of standard practice to forecast either scenario, so all you can really do here is create a high-level guesstimate.
Forecasting Live Chat
If you, like many other contact centres, decide to implement live chat as a contact centre channel, it is difficult to approximate:
- What percentage of your overall contact volume will come through the live chat channel
- If your overall contact volume will increase or decrease with the new addition
- How take-up of live chat will increase over time
One way to create initial forecasts for live chat is to get in touch with another contact centre and ask them: for every 1,000 visits your website gets, how many live chats do you receive? Hopefully, they will then be able to provide you with a ratio.
Then, if you promote your live chat option in a similar way to the other organisation, from this ratio, you can determine how many people will likely use live chat from the number of visitors your website receives.
Over time, you can then build your own model based on data from your own website. This data can then be tracked over time and used for future forecasts.
Another method would to be to start live chat off with a small team and limit the number of customers who can see the live chat option on the website. By doing this, you can get an idea of you demand as you go.
However, other channels aside from live chat have even greater challenges for creating forecasts.
Messaging apps – according to Richard Abdy of The Forum – are particularly difficult to forecast.
Richard says: “The customer is now king, as has become evermore the case with the emergence of asynchronous messaging. With a channel like live chat, the conversations are usually an instantaneous back and forth, but messaging apps do not work like that.”
“Messaging, in terms of customer service, is almost like a tennis match, as in the customer can call a break whenever they want to call a break, which could even be overnight. So, how do you carry it over? And how can you forecast that?”
“We’re going into a new era in forecasting, with all of these new channels, which is only going to make the skill more complex.”
Fortunately, though, it is easier to forecast an estimate of contact volumes when an organisation releases a new product/service. This can be done through finding out from the revenue plan how many products will likely be sold and examining data from previous releases of products.
The data from old releases will provide you with a ratio of contacts to purchases. You can use this ratio to forecast a number of contacts expected for the new release by using the forecast number of products you are predicted to sell.
How Do Our Readers and Other Industry Experts Recommend Forecasting With Minimal Data?
In order to find out the approaches that different contact centres take to this problem, we went out to our readers.
Below are their suggestions for how to generate a forecast if you don’t have much data.
Model Propensity to Contact

My approach would be to explore the customer experience and determine the main reasons for contact. Then make some assumptions around the propensity to contact for each of those reasons against the active customer base.
Once you have done this, you can use those ratios against the customer base as it grows, refining them individually, in line with actual volumes until you have a functioning forecasting model.
However, you will need to be able to track volumes by contact reason and have good visibility of the number of active customers to achieve this.
The more you understand the factors that drive the volume, the more volume you can account for in your forecasts, incrementally increasing the accuracy.
You can start this process with a couple of months’ worth of GOOD data.
Contributed by: Stephen Willis, a customer service manager at Moët Hennessy
Run Two Test Campaigns With Two Groups

If no data is available, run two test campaigns with two groups for a minimum of one month and use the data as a base figure by averaging the performance of the campaign.
From there, do a rough forecast based on staff numbers, data quality and expected performance, seasonal/regional/product variables (if relevant) – adjust forecast every two weeks as more data comes in.
For the first month, focus on these test campaigns. Use the test campaigns as market research or product research. Why invest in a full campaign if not completely feasible? The test campaign will provide enough data to determine if this campaign is worth the risk of building a full campaign or team.
Using that same data, build a forecast and then adjust as the campaign moves along, remaining conservative with your expectations.
For variables like seasonality, look at similar products or the habits of your target market and use common sense if you expect to see a drop or uptick in performance.
Contributed by: Charles Williams, an experienced contact centre operations manager
Use Correlational and Stochastic Analysis

When building forecast models for complex or highly dynamic environments, we use mixed modelling techniques. These models are a combination of time series layer, regression layer, stochastic layer and intelligent auto error correction layers.
With minimal data, you are missing data for time-series base layer. If you have very limited historical information, a good approach would be increase the weightings towards correlational and stochastic analysis.
Goodness-of-fit simulations can show which model works best for your data sets. It all depends on the nature of the business and related variables. There is no single solution ever in forecasting.
Contributed by: Neeraj K. Thakran, former Head of Workforce Management at Sitel
A Good Old-Fashioned Spreadsheet

I’ve had a few occasions where I’ve got no or virtually no data. There’s no quick way of addressing this. It requires a bottom-up analysis of all tasks and contacts and (without wishing to sound like a dinosaur) a good old-fashioned Excel spreadsheet approach!
I presume the objective here is to forecast volumes, AHTs, seasonality and FTE requirements? Then I find that the seasonality or ‘busy period’ part of the analysis to be crucial. When I’ve done this before, a painstaking approach can get you to 95% accuracy.
However, you must be cautious! I’ve inherited a situation where someone had done this before I arrived and they made no allowance for shrinkage… it was carnage!
Contributed by: Dan Cuthbert, Cuthbert Consulting
Focus on “What if” Scenarios

A good starting point is remembering that a forecast is simply a guess. It might be one based on lots of data and analysis, but a guess is what it remains.
Once you appreciate that, you can produce a forecast in any way that produces the outputs you require – usually an understanding of how to staff something.
There are lots of comments on ways this can be done, using comparative work types, industry research etc. The trick is to produce What If scenario plans – assume you will be wrong, because you will be, and produce plans of how you can cope when you are – up or down.
It’s quite common for people comfortable with numbers and creating forecasts to be slightly paralysed by the desire to get 100% accuracy. The reality, of course, is that if they were that good then they wouldn’t be forecasting contact volumes, but more likely billionaires.
While it’s a very valuable skill and role within a business, imagine companies like Honda, Audi or Ford with a well forecast inventory and what would happen to their production line.
However, on most occasions, the value add is providing the ability for the business to prepare for the variations – obviously that works best with an accurate forecast. But I’d suggest as much time is spent prepping for variation as we do seeking for perfection.
Contributed by: Robert Tuck, Senior Director of Workforce Optimisation at West Unified Communications
Use Conversion Rates
I usually look at the product/service and look at metrics such as conversion rates.
Then, depending on the industry and market (mentality of different countries and their preferred contact channels, for instance) I set expectations low, but usually calculate with 5–8% contacts of conversion rate.
I double-check each quarter and adjust, monitor daily and have the CRM/service desk set up to track contact reason, method etc.
Contributed by: Rene
For more on how you can use conversation rates to create forecasts, read our article: Forecasting Contact Volumes Based on Sales Predictions
Build a Model and Update

Use what you have – even just last month should give you a feel for what next month will look like.
Look elsewhere for data – if you have had similar campaigns in the past, or other clients in the same industry, they may give you some insight as to what to expect.
Add in a little gut feeling. Is it likely to be seasonal? Which seasons will be high and which ones low? Is the customer base growing? Are there any call drivers you can identify (for instance billing cycles) even if you do not know exactly what impact they will have?
But overall, my advice is to just get started – even if it is more guesswork than science. Once you have a model built, you will be better able to identify where it is wrong, and so with every new day of data you can start to make corrections.
Contributed by: Connor Bourke, CEO at Optima WFM
Start With a “Bottom-Up” Approach

Assuming your arrival patterns will end up being time series based – a fancy way of saying that past patterns will serve well as a good basis to forecast future patterns – you can do what is called ‘bottom-up’ forecasting.
Clearly days one, two, three and all the early days will be all hands on deck, since patterns aren’t yet established. If you’ve launched campaigns or worked in outsource, you know this feeling well.
Take an Excel spreadsheet and plug in the actual data from your first day of operation – say Monday. Be sure to use intervals that are appropriate for your situation and do the same for each day that follows.
By the time ‘next’ Monday comes, you can look back at your ‘first’ Monday. By the time your ‘third’ Tuesday comes, you can look back at the results of your first ‘two’ Tuesdays.
The advantage of bottom-up is that it is easy to do! It is not as highly accurate. But it gets you moving in the right direction.
Contributed by: Daniel Ord, Founder and Director of Omnitouch International
For more on contact centre forecasting and workforce management (WFM), visit:
- 10 Things You Must Know to Calculate How Many Contact Centre Advisors You Need
- How to Calculate Forecast Accuracy
- The Three Forecasting Timelines Used in Contact Centres
Author: Jonty Pearce
Reviewed by: Robyn Coppell
Published On: 19th Sep 2018 - Last modified: 15th Aug 2025
Read more about - Workforce Planning, Dan Cuthbert, Daniel Ord, Editor's Picks, Forecasting, Intrado, Live Chat, Richard Abdy, Robert Tuck, Staffing, Workforce Management (WFM), Workforce Planning