


Average Handling Time (AHT) is a key metric for contact centres and BPOs, tracking how long it takes to handle a customer interaction.
It’s crucial for understanding efficiency but must be balanced with customer satisfaction. So how do you measure it?
In this article, we’ll cover how to calculate AHT, why it matters, and how to use it effectively without compromising service quality.
What is Average Handling Time?
Average Handling Time (AHT) is a key calculation for any contact centre planning system, as it tells you how long a new item of work takes to be handled, and not just the talk time.
In essence, it tells you how much time an advisor spends working on a task and when they are unable to deal with a new work item. It also helps you understand and improve your Calls Per Hour (CPH) rate. However, it’s important not to reduce AHT at the expense of the customer experience – as our consultants panel explain in this article.
It is the bedrock for all contact centre planning systems, as well as a key component of all Erlang calculations, and unless you know this metric you cannot plan effectively.
For more on the topic of Erlang calculations, read our article: How to Work Out How Many Staff You Need in a Contact Centre
The Average Handling Time (AHT) Formula
To calculate average handling time, you add the total talk time, total hold time and total wrap time together, and divide it by the number of calls handled.
The AHT formula is as follows:
Average Handling Time (AHT) = (Total Talk Time + Total Hold Time + Total Wrap Time) ÷ Number of Calls Handled
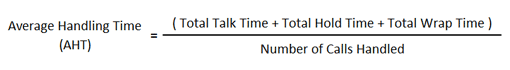
Here is a breakdown of each part of the formula:
Total Talk Time: This is the total amount of time agents spend actively speaking with customers during calls. It includes the conversation but not the time spent on hold or after the call.
Total Hold Time: This is the time customers spend on hold during a call while the agent looks up information, consults a colleague, or processes a request.
Total Wrap Time: After a call ends, agents often need time to log details, update records, or send follow-ups. This is known as wrap-up or after-call work (ACW).
Number of Calls Handled: The total number of customer interactions (calls) completed within the time period being measured.
Wrap-up time may also be known as Wrap Time or After-Call Work time.
Worked Example
All of the following data can be pulled from the contact centres Automated Call Distribution (ACD) system or, failing this, can be gathered from Call Detail Records (CDRs).
The data used in the example below, is the accumulation of all the length of all calls throughout one day in the contact centre.
Total Talk Time: 7 days + 17 hours + 36 minutes + 45 seconds = 668,205 seconds
Total Hold Time: 1 day, 3 hours + 32 minutes + 33 seconds = 99, 153 seconds
Total Wrap Time: 2 days, 7 hours +5 minutes + 6 seconds = 198,306 seconds
Number of Calls Handled: 4311 calls
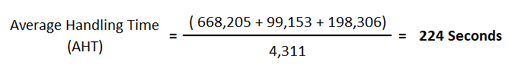
If your ACD system produces an average figure for total talk time, total hold time and total wrap time, there is no need to divide the sum of the figures by the number of calls handled.
AHT by Industry
| Industry | Average talk time (minutes) | Average hold time (seconds) | Average Handling Time (AHT) |
|---|---|---|---|
| Consumer/Professional Services | 3.55 | 3.34 | 6.89 |
| Financial Services & Insurance | 4.01 | 4.13 | 8.14 |
| Government & Public Sector | 4.13 | 4.09 | 8.22 |
| Healthcare | 3.38 | 4.59 | 7.97 |
| Hospitality | 3.11 | 4.33 | 7.44 |
Average Handling Time is Different from Average Call Duration
Ring time and queue time are not usually included in AHT, as these are not related to the period of time that an advisor spends on a call. They are normally included in Average Call Duration.
What Shouldn’t be Included in Average Handling Time
Contact centres often misuse AHT by including the time that it takes advisors to do things – like toilet breaks, special projects and team meetings – in their calculations.
However, AHT only takes into account the time from when the caller gets through to an advisor until they have hung up. Everything else, including the examples given earlier, should be included in shrinkage calculations.
To find out everything that should be included in shrinkage calculations, read our article: How to Calculate Contact Centre Shrinkage
Factors That Can Distort AHT
There are a number of factors that can distort AHT:
Cutting off Callers
If you target advisors on their AHT you may find that they cut off long callers or, if a call looks difficult, they may transfer it to another department.
In fact, there are a number of tricks that some advisors play, such as sitting on a call transfer, hiding behind a IT problem and calling their own phones.
To learn all of the tricks of the trade, which may be impacting call duration, read our article: 7 Tricks That Call Centre Employees Play
Wrap Time Efficiency
Wrap-up time should only be used for time related to the particular call. However, some advisors will use this to stop taking the next call, and it is frequently misused for toilet, coffee or cigarette breaks, or for chatting between calls.
Yet, it isn’t only the contact centre team who may be at fault here, slow computer systems are a likely culprit, which certain advisors may be better at navigating than others.
Whether or Not Hold Time is Included Calculations?
You need to make sure that you include Hold Time in the calculation, as not doing so can result in advisors spending more time on hold in order to reduce the total AHT.
This can negatively impact the customer if they are put on hold unnecessarily at multiple points during the call.
Factors That Drive up AHT
If your AHT is higher than it should be, there are a number of factors that could be to blame:
- Slow computer systems (this is a common problem)
- Spending time with a caller to resolve a problem (this is a good thing)
- Poor advisor training (listening to advisors who have long handling times may highlight individual training needs)
- Flipping between lots of different computer systems
- Long periods of time on hold
For more information on reducing AHT, visit these articles next:
Use of AHT as a Performance Metric
Many contact centres use AHT as a personal advisor target as well (in fact, in a number of surveys, it is consistently cited as the most common metric in contact centres) although this is normally deemed a ‘bad thing’.
The problem is that it tends to (either intentionally or unintentionally) make advisors focus on speed of service rather than quality of service. It also tells you nothing about the outcome of a call.
It tends to drive a behaviour of advisors trying to manipulate the AHT.
Symptoms of this include:
- Cutting off calls as they approach the AHT target
- Not doing after-call work or following up on customers
- Transferring difficult calls to another department
- Rushing the caller off the phone
- Not listening to the caller or building rapport
- Making promises to the caller that are not kept
Companies that have removed AHT as an agent performance metric have often found that, after an initial rise in AHT, the First Contact Resolution rates tend to improve.
It is important to note that AHT should be viewed as a performance indicator rather than a strict agent target. Since it is an average, individual AHTs can vary significantly between agents. Relying on it as a primary metric may lead to inconsistencies rather than ensuring process control.
AHT is Not Distributed Evenly
Once you have calculated your AHT to be five minutes, for example, it would be easy to expect that calls would be distributed around the five minute mark, as follows.
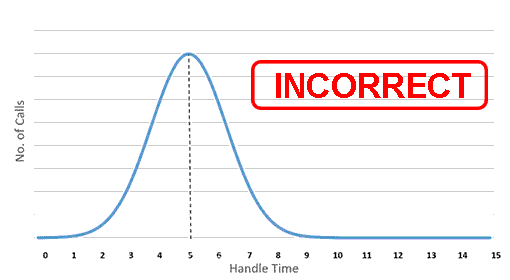
This graph is called a normal distribution, but calls that come into the contact centre are not distributed in this fashion. Instead, they are distributed in the pattern of the Erlang distribution, as shown below.
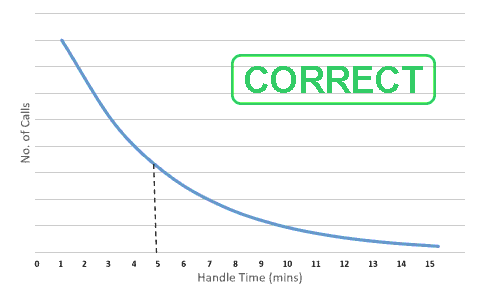
Knowing this is helpful when calculating the number of advisors needed in the contact centre at a given time. This is because it helps to justify why the Erlang C Calculator may seem to overstaff for low call volumes.
To meet the contact centre’s desired service level, it is important to have the correct number of advisors in place, in any eventuality. And, as highlighted in the graph above, there will be a few calls that last much longer than the handle time.
Just on of these calls can offset a contact centre, which has foretasted low contact volumes. So, the Erlang Calculator takes such a situation into account when making its calculations.
For more on this subject, read the article: How is Average Handling Time Distributed? It is Not How you Think!
Don’t Forget the AHT Glide Path
The AHT glidepath is the time it takes an agent to reach proficiency in a contact centre. When agents come out of induction training they will typically have a much longer average handling time than when they become fully proficient.
That period could be anywhere from six weeks to three months, possibly even a year in a complex technical area.
The glidepath is the formula that shows that proficiency happening over time and that glidepath is what’s called an exponential decay.
Watch this video to find out more and you can also download a free copy of the spreadsheet.
To find out more on AHT, you can read our articles:
- Why Do Different Advisors Have Such a Wide Variance in Average Handling Time?
- Six Ways to Manage AHT in Multichannel Contact Centres
- 47% of Contact Centres use Average Handling Time (AHT) to Target Agents
Author: Jonty Pearce
Reviewed by: Hannah Swankie
Published On: 18th Oct 2017 - Last modified: 15th Aug 2025
Read more about - Customer Service Strategy, AHT Glidepath, Average Handling Time (AHT), Call Handling, Erlang Calculations, How to Calculate, Service Strategy