


We investigate how you can reduce your Average Handling Time (AHT) without risking advisor quality levels and Customer Satisfaction (CSat).
The Importance of AHT
Average Handling Time is a key metric from a workforce management (WFM) perspective, as it plays a key part in calculating a contact centre’s staffing requirements.
As your AHT decreases, so the required workload capacity reduces. This means that the number of advisors that you need to handle your customer contacts goes down. This makes it an attractive measure to target, in order to lower staffing requirements and therefore reduce costs.
So, with this being the case, over a number of years, contact centres have attempted to reduce AHT by simply asking advisors to speed up their calls.
Unfortunately, this has led to advisors picking up bad habits, resulting in lower CSat scores and lower First Contact Resolution (FCR) rates, as they look to rush through their customer conversations.
This leads to failure demand and repeat calls, meaning that contact volumes rise and, counter-productively, the outcome is that more work has been created for the operation.
Rethinking AHT
Instead of thinking of AHT as a singular metric, it is first important to recognise that is composed of the following three elements:

Talk time – The conversation time between a customer and an advisor, which starts as soon as the advisor accepts the contact from the queue.
Hold time – The time for which the customer is put on hold, either so the advisor can go off and find any additional information or so the customer can be transferred to a different advisor.
Wrap time – The time after the customer–advisor conversation has come to an end, which covers the advisor completing their After-Call Work (ACW).
It is important for you to know this because, if you want to sustainably reduce AHT, you need to find safe ways of reducing each of these component parts.
With this in mind, let’s look at safe ways of reducing talk time, hold time and wrap time, by as much as 20 seconds.
Reduce Talk Time
To safely reduce talk time you can use any one of the following four methods:
- Create a quality team focus on identifying conversation time that doesn’t add value
- Use screen-pop technology to present advisors with important customer information as soon as the call is delivered to them
- Coach advisors on call structure so that they can signpost calls to better guide the conversation
- Review and update your knowledge base so that it’s easy for advisors to find helpful content
Reduce Hold Time
To safely reduce hold time you can use the following three methods:
- Ensure call routing delivers a high proportion of calls to primary skilled advisors who have the necessary skills to resolve the enquiry
- Identify call types with high call transfer rates and do more coaching to advisors to increase their knowledge in these areas
- Find ways to reduce contact centre attrition by recognising and rewarding your top performing experts
Reduce Wrap Time
To safely reduce wrap time you can utilise any of the three methods below:
- Teach abbreviations and system shortcuts to advisors to speed up the logging of call notes
- Ensure that wrap time isn’t being used as an excuse for taking a short break between calls by tracking advisor actions through activity reports
- Use an ACW timer to define a threshold to complete the call-wrap process, as a psychological device to manage advisor behaviour
Measuring Gains in These Three Areas
Any modern telephony system will record handle times and will be able to break AHT down into these three constituent components, so you can track the impact you’re having in making improvements across each of these three areas.
Also, the telephony platform will allow you to report AHT for the entire contact centre, across different contact types/reasons and at an individual advisor level.
It is at this individual level where you can perform quartile analysis, which could offer you the opportunity to monitor the impact of your improvement activities.
Quartile Analysis
While we report on AHT across the entire contact centre, the problem with using just one average is that it doesn’t tell you the whole story and the spread of your handling times across the “advisor population”.
Quartile analysis instead enables you to examine the variance between your advisors’ individual AHTs and split the advisor population into four equally sized groups.
This means that Q1 group would include the 25% advisor population with your lowest AHTs, and that would go up to Q4, which would include the 25% advisor population with your highest AHTs. This is highlighted in the chart below.
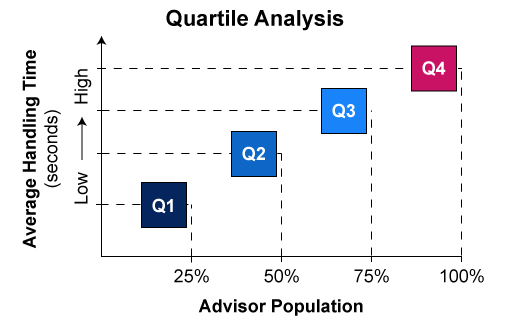
The benefit of doing this is that, by looking at the averages across each quartile, you’ll see a far greater range of performance than you would have otherwise imagined.
According to Paul Weald, the Director at mcx, “This can be insightful because you can start to identify how you might replicate the behaviours of your best quartile group (Q1) and start to cascade that to other team members.”
In fact, you could undertake quartile analysis across both the AHT and CSat metrics, highlighting advisors who are in the top quartile for both metrics, before listening to some of their call recordings to find best practices to coach and replicate.
But, before we get into that, let’s take a quick look at a worked example of quartile analysis to ensure we are using the technique to its full potential.
A Worked Example That Could Help to Knock 20 Seconds Off Your AHT
From the above, we know that quartile analysis gives us the quantitative ability to move the AHT metric by nudging advisors to achieve incremental improvements.
Take the below as an example. In these results, from a real contact centre, there was a 150+ second spread between Q1 and Q4.
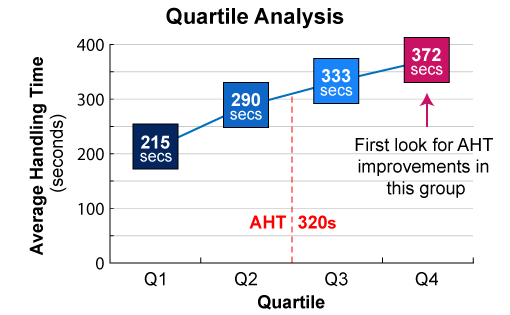
In this centre it was found that achieving a 10% improvement in AHT across each quartile equated to 20 seconds saved in terms of overall AHT for the centre as a whole. So there is great value in adopting this quartile approach.
Instead of having very generic conversations about how individuals compare to the overall AHT, team leaders can have better-informed advisor feedback sessions, varying their coaching approach, depending on the quartile that the advisor is in.

Paul Weald says: “For those that are in quartile one, you want to understand what they are doing well, assuming they’re not taking any quality shortcuts, and then recognise them for their expertise.”
“When it comes to those in quartile four, it’s much more achievable for an inexperienced advisor to make a series of five- or ten-second improvements, so team leaders need to apply relevant coaching approaches depending on which quartile each advisor is in.”
This is a way of being able both to understand the root causes of AHT and to also identify the best practices and call control techniques which certain advisors are using to lower AHT, which can be replicated by other advisors in quartiles two, three and four.
Don’t Look at AHT in Isolation
We can’t just look at the behaviours which lower AHT without assessing their impact on other customer-facing metrics, such as quality scores, CSat and FCR. We can use quartile analysis to help us do this, just like in the example below.
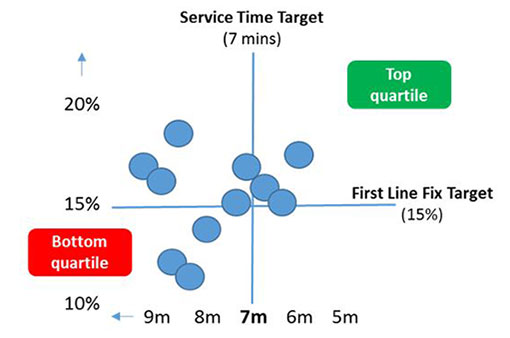
When a service helpdesk organisation that Paul worked with applied this technique, they plotted two metrics AHT and First Line Fix.
There was both a customer benefit and commercial benefit to being able to resolve the enquiry on the call, as this not only resolved the customer issue but also avoided the need to schedule an engineer visit.
So, the top quartile performers were those that achieved the highest resolution rates in the shortest time.
Quartile analysis allowed this organisation to recognise that new starters made up the majority of those in their bottom quartile, as they had the least on-the-job experience.
Upon reflection, this company realised that new starters needed coaching to help them achieve the resolution rates that more experienced team members were achieving.
Once advisors became more knowledgeable, then call handling technique and after-call work became the focus to reduce AHT.
So this organisation was able to lower AHT by using quartile analysis across two metrics to identify:
- Which individuals needed additional coaching support to improve their job knowledge
- The best practices in reducing AHT safely, without a counter-productive impact on quality
- If it’s best to focus primarily on talk time, hold time or wrap time
Use the AHT Glide Path
The AHT glidepath is the time it takes an agent to reach proficiency in a contact centre. When agents come out of induction training they will typically have a much longer average handling time than when they become fully proficient.
That period could be anywhere from six weeks to three months, possibly even a year in a complex technical area.
The glidepath is the formula that shows that proficiency happening over time and that glidepath is what’s called an exponential decay.
Watch this video to find out more and you can also download a free copy of the spreadsheet.
In Summary
If you want to safely knock 20 seconds off your AHT, then you need to look at each of the individual components – talk time, hold time and wrap time – alongside a quality measure such as CSat or FCR.
There are lots of small things that you can do to reduce each of these elements of AHT, but to find out which methods work best for your contact centre, use quartile analysis.
Quartile analysis splits your advisors into four groups depending on their individual AHTs. You assess the group with the lowest AHT to find out what they’re doing well by listening to their call recordings.
With the insight into what this group do really well, coach advisors in order to “nudge” the AHTs of quartiles two, three and four down by a certain percentage. This will systematically lower your overall AHT.
However, you need to ensure that the best practices that you share with advisors don’t negatively influence CSat or FCR.
With this in mind, only assess the calls/contacts of those in quartile one with consistently high CSat/FCR scores, so you avoid looking at AHT in isolation.
This overall process will help you to reduce your overall AHT sustainably and therefore lower costs, as a result of applying good operational management practices. Good luck!
For more on using AHT in the contact centre, read our articles:
- 49 Tips for Reducing Average Handling Time (AHT)
- How to Measure Average Handling Time (AHT)
- Is Reducing Average Handling Time (AHT) a Good Idea?
Author: Charlie Mitchell
Reviewed by: Megan Jones
Published On: 12th Jun 2019 - Last modified: 21st Jan 2026
Read more about - Call Centre Management, After Call Work (ACW), AHT Glidepath, Average Handling Time (AHT), Charlie Mitchell, Editor's Picks, Management Strategies, Paul Weald, Workforce Management (WFM)