


In this article, we look at how average handle times are distributed and detail how this information can benefit your contact centre.
Do not make assumptions based on Average Handling Time (AHT)
If your Average Handling Time (AHT) is five minutes, many of us will automatically fall into the trap of believing that the range of handle times in the contact centre will fall equally around that five-minute mark. This assumption would follow the outline of the graph below.
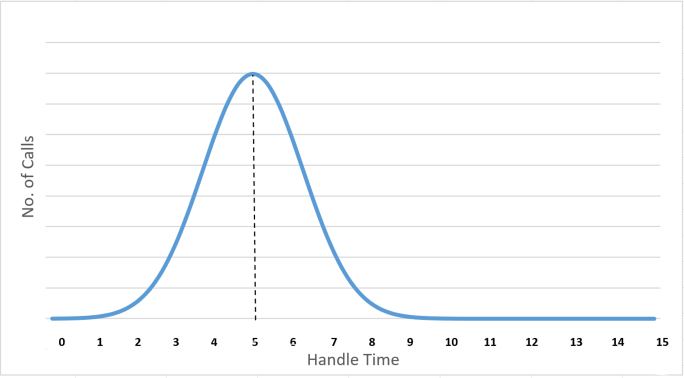
This graph is called a normal distribution, but it is not the way that call distributions work.
So, it must be a Poisson distribution?
Many call centre experts will recognise the problems noted earlier and suggest that you to follow the curvature of a Poisson distribution model, as found below, to calculate incoming call durations.
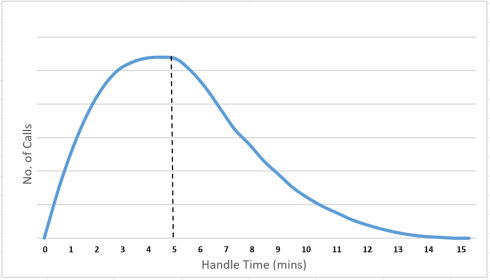
Yet, these experts are only partially correct. Calls are distributed using a Poisson distribution, but the curve does not look like this.
However, as will be proven later, most calls that enter the contact centre do not last for longer than half a minute. So, the peak of the graph should be pushed further to the left, forming the shape of an Erlang distribution.
How calls are actually distributed: the Erlang distribution
An Erlang distribution uses a special logarithmic case of a Poisson distribution model, where the positive integer, k, equals one. This, in effect, is an inverse power law and means that the distribution instead follows this route:
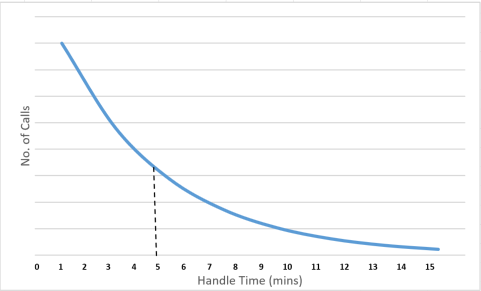
Although this Erlang distribution was formed to measure the time between incoming calls, it is now being used for the purpose of calculating the expected duration of incoming calls to yield information about call volumes. This is because it forms a much more factual representation of the relationship in between call volume and duration.
Here are three things to note about real-life call distributions ;
1. Few calls have the distribution around the AHT
As you can see from the Erlang distribution graph, a call centre’s AHT is much longer than the likeliest call time, which is denoted by the line’s highest point. This is because AHT does not work on the modal average, it incorporates all handle times, including long-duration calls, which can be seen by the kinks at the right hand side of the x-axis.
2. There are lots of short-duration calls
The line’s highest point marks the shortest duration of call possible, which, according to the graph above, highlights that the likeliest outcome for a call is only to last for a few moments. This is because contact centres are prone to a large amount of straightforward interactions (which include routine answers), misdialling that leads to wrong numbers and because other calls that come through on the customer’s end, as well as other routine situations.
3. There are a number of long calls
Whilst it is common to receive very short calls, the call centre needs to be prepared for a significant number of interactions to last for a long time in excess of the average – perhaps for even over one or maybe even two hours, as can be the case. This will most probably be due to the customer having a serious company-related problem, and although this call type may be rare, contact centres must prepare for their inevitable arrival.
Below, you can see an annotated version of how these factors combine to result in the formation of this Erlang distribution.
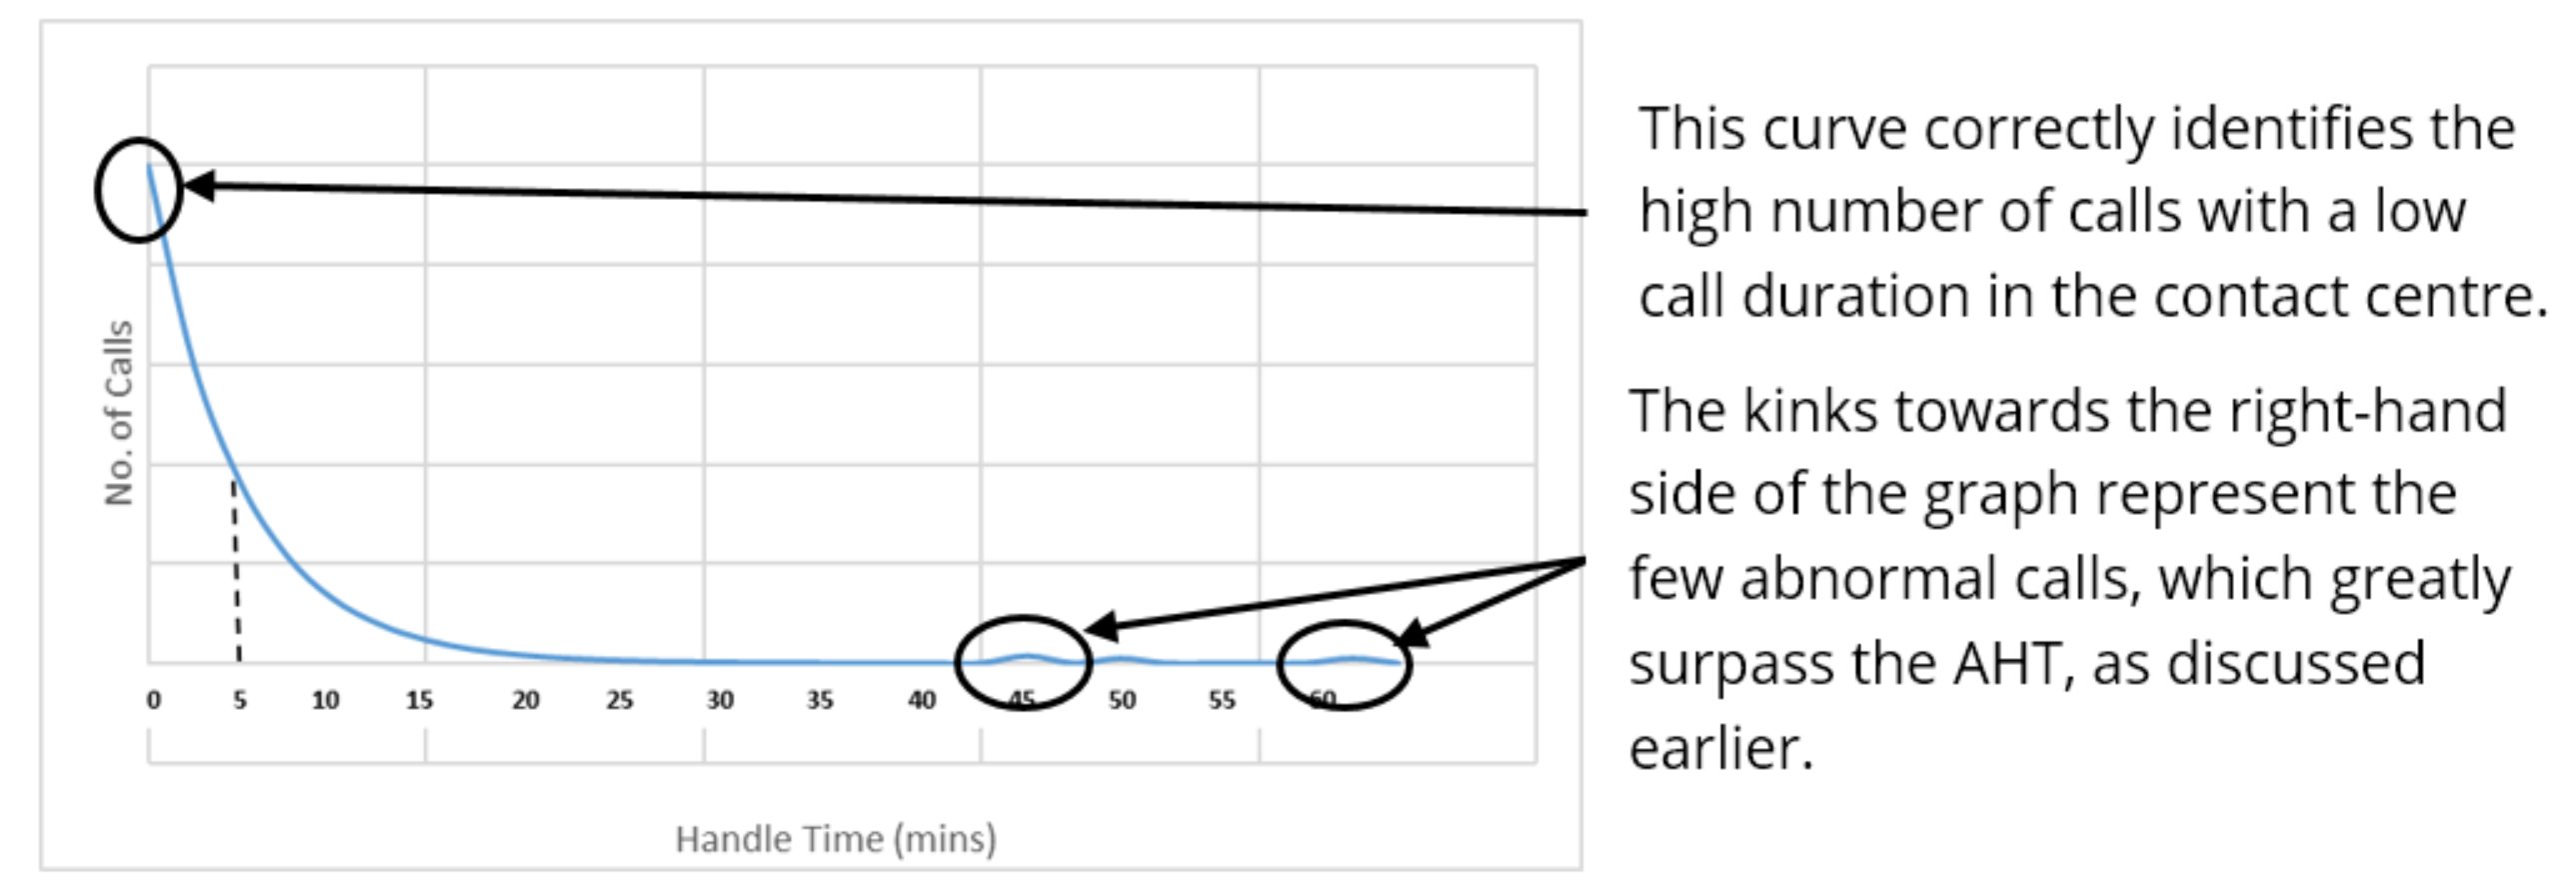
The graph also highlights how you cannot make assumptions solely based on AHT, as it is not completely representative of call durations, due to the few outliers here that are completely exceptional.
Contact distribution in multichannel platforms
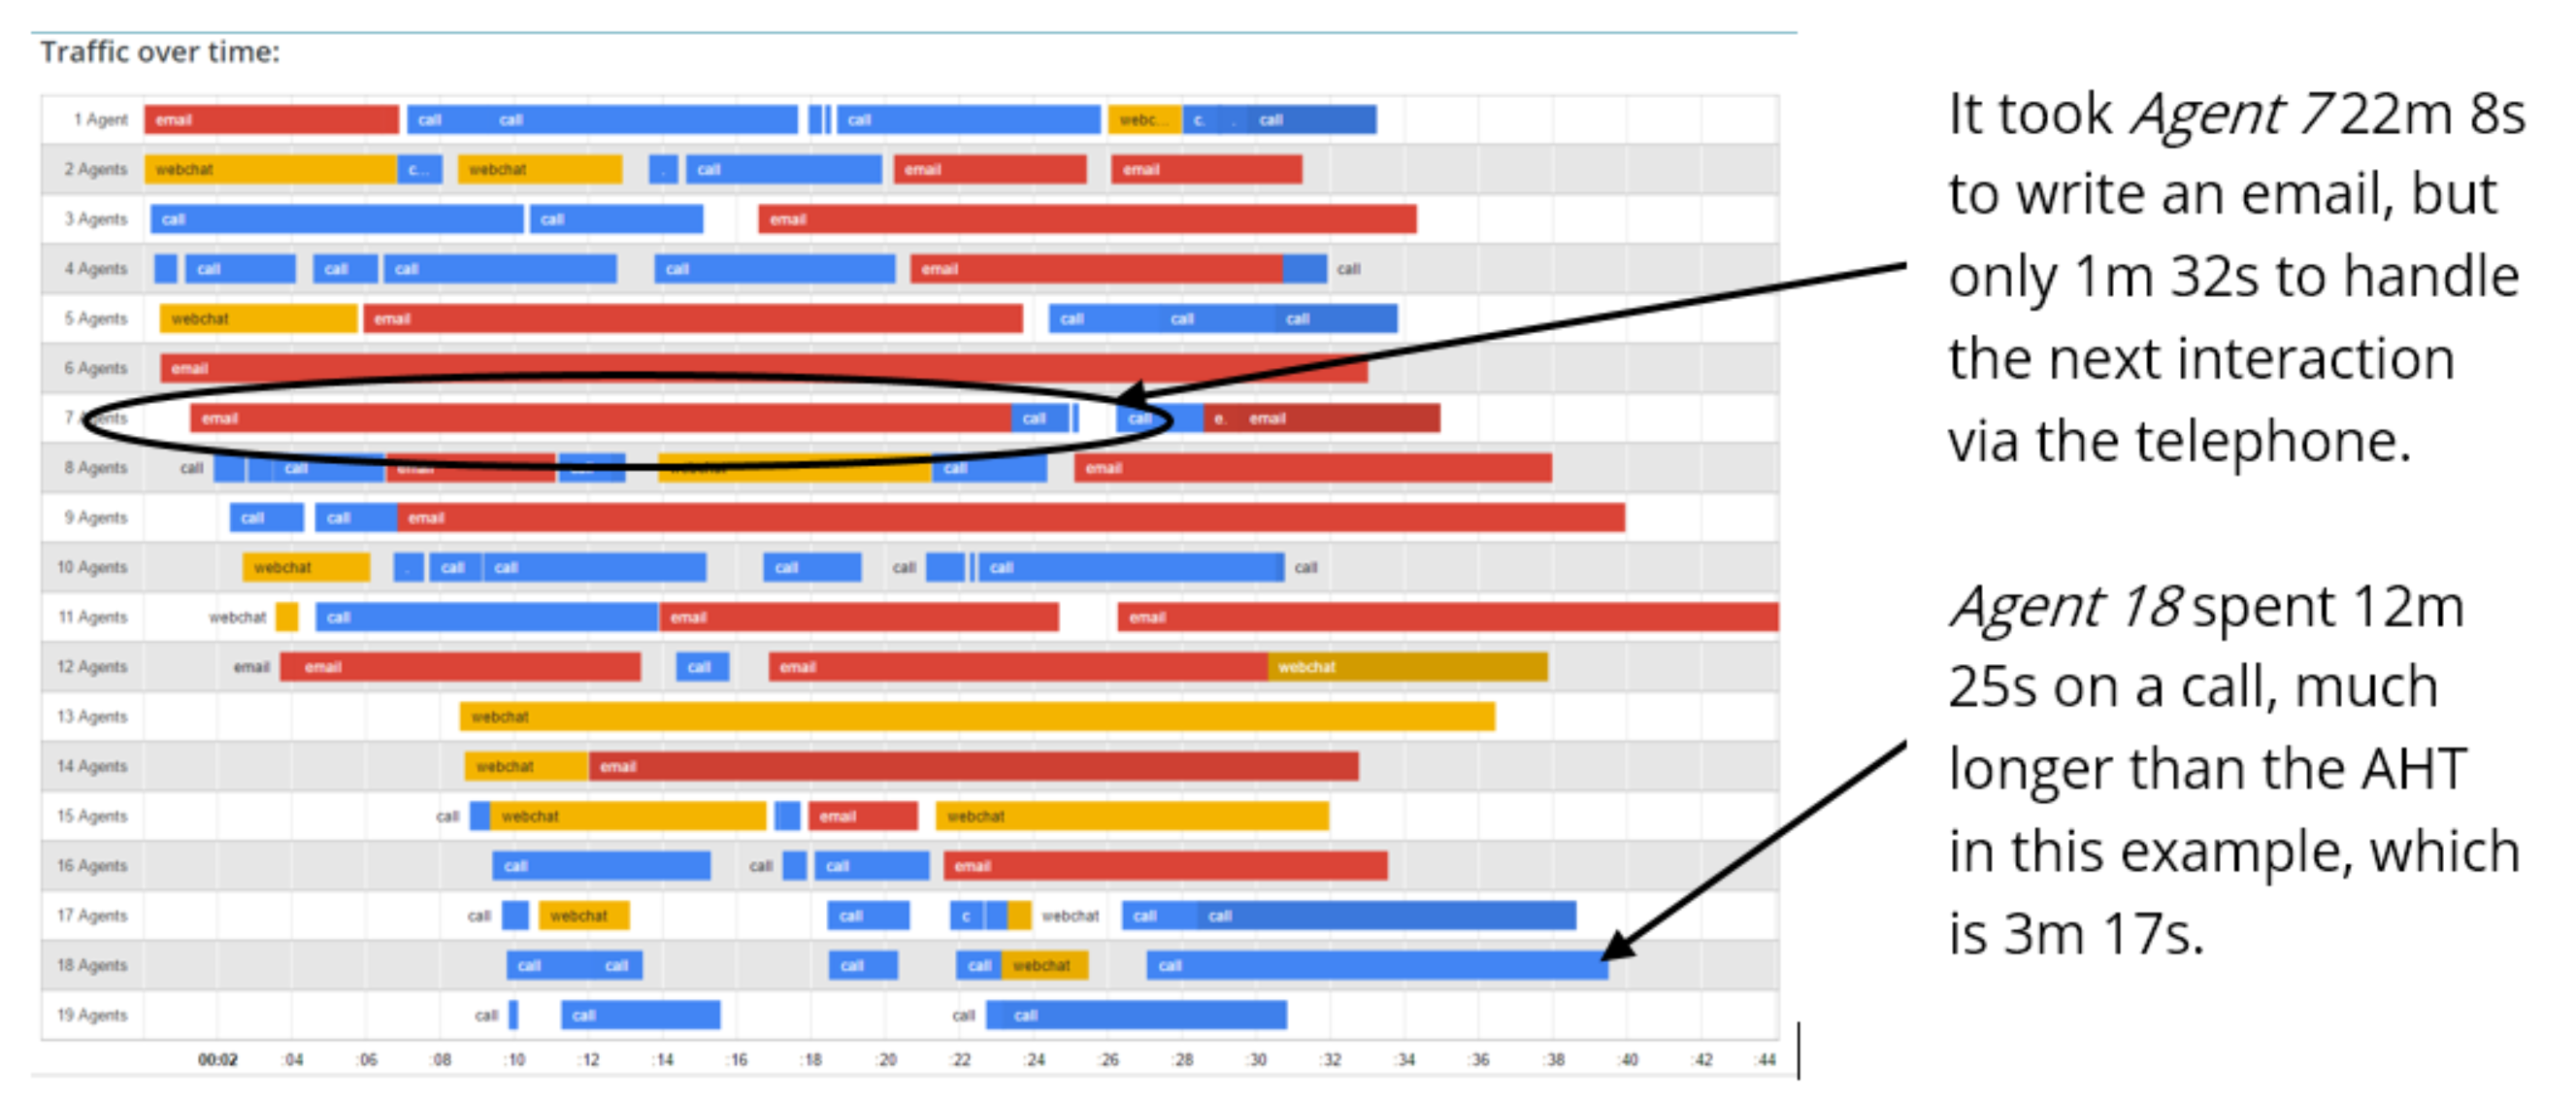
Another reason that you should not make assumptions based on AHT is because most contact centres now deal with digital platforms, such as emails and webchats, which will generally occupy more of the agent’s time. This means that the AHT of telephone calls cannot be used for other communication channels, as in the image below, taken from our multichannel calculator.
A practical example
The notion that the pattern of an Erlang distribution correctly reflects the relationship between the number of calls a call centre receives and their duration has been confirmed by CARE4CC, a company that focuses on the care of contact centres.
CARE4CC created the graphic below in their research, based on the inbound calls of real call centres, and it reflects the pattern of an Erlang distribution, as the bars in the chart are on a logarithmic scale.


Lode Vande Sande
CEO of CARE4CC, Lode Vande Sande, commented on the findings, stating: “We found that the average call duration is typically very far off from the mode call duration (most frequent occurring call duration) indicating that the average is heavily distorted by the outliers.
“Hence, talking about average values sometimes makes close to no sense as the average is no longer representative for the data that one has, hence often making conclusions based on the average completely wrong.”
How can you use this information?
The information that this Erlang distribution provides is particularly useful when you calculate the number of call centre agents you need in the contact centre, as it helps to explain why the Erlang C Calculator appears to overstaff for low call volumes.
To show you how it does so, we can use the example of when:
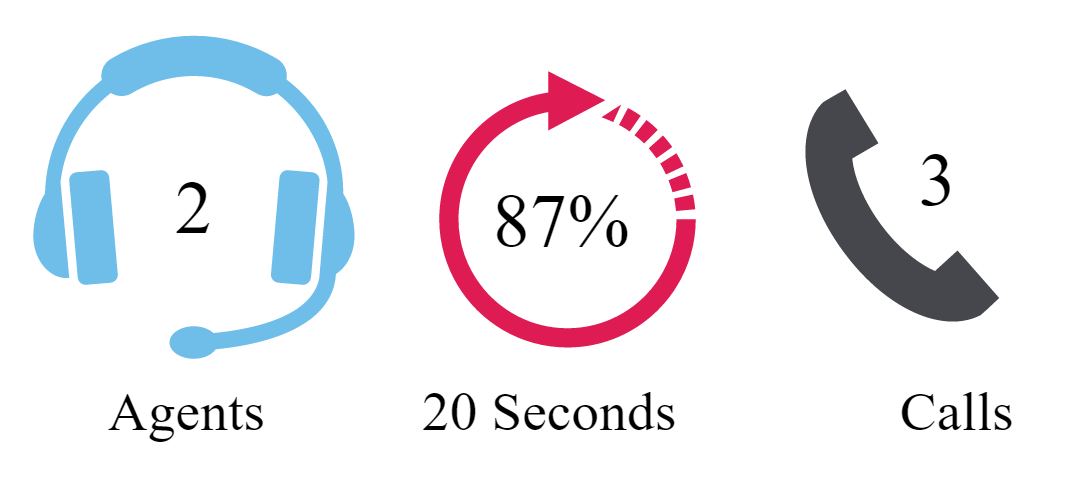
AHT: Five minutes
No. of calls: Three
Target service level: 80%
Target queue time: 20 seconds
Given these variables, you would assume that you would only need one agent in the building to handle each of the three calls, especially if the majority of them were well under five minutes, according to an Erlang distribution. So, your traffic would be something like below, right?
Well, this would be correct for most occasions. However, in order to meet your target service level and queue time, your call centre should be sufficiently prepared for other eventualities. These eventualities could include situations similar to the example below.

As you can see from this graphic (taken from our multichannel calculator), there is the possibility that two calls could come at once and therefore it would be impossible to answer both calls with just one agent.
Also, the Erlang Calculator does factor in the kinks at the end of an Erlang distribution, which represents a call that greatly surpasses the AHT, as seen in the following image.

In this image, the second call that the first agent takes greatly surpasses the five-minute AHT, lasting for 20 minutes, justifying the kinks in an Erlang distribution graph.
All of this information, taken from an Erlang distribution, is factored into our Erlang Calculator (which is also available in a handy Excel spreadsheet), which, as seen below, dictates that you need two agents to be available.
This demonstrates that the information that an Erlang distribution provides is particularly useful when calculating how many agents you need in your contact centre.
Find more information on the Erlang distribution by visiting Wikipedia’s useful page.
Don’t Forget to Use the AHT Glide Path
The AHT glidepath is the time it takes an agent to reach proficiency in a contact centre. When agents come out of induction training they will typically have a much longer average handling time than when they become fully proficient.
That period could be anywhere from six weeks to three months, possibly even a year in a complex technical area.
The glidepath is the formula that shows that proficiency happening over time and that glidepath is what’s called an exponential decay.
Watch this video to find out more and you can also download a free copy of the spreadsheet.
Author: Robyn Coppell
Reviewed by: Megan Jones
Published On: 8th Feb 2017 - Last modified: 13th Aug 2025
Read more about - Workforce Planning, AHT Glidepath, Average Handling Time (AHT), Editor's Picks, Erlang Calculations, Omnichannel, Workforce Planning


Nice article. Great reminder to non-call center stat guys and finance types
This is yet another support for proper KPI baselines, supportive processes, and intuitive software for frontline workers. If the Erlang Calculation is able to thin the staff, do not thin staff before getting the back office portions corrected.
We have a contact centre and our AHT is 4 min and we have 7 shifts and in one shift we have 20 agents and in 30 min interval we get 300 calls please suggest on that
Hi,
Why the erlang formula requires more idle time for less handle time?
In other words, I did a simulation for a staffing, and for the same opened hours et calls volumes, I will need (according) less occupancy rate for a shorter AHT.
Need an answer please
Thanks in advance
GHO. It is all to do with the probablity that a call has to wait. If you wnt short wait times then you need to have more staff waiting for calls to arrive.
So there is a trade off between occupancy and idle time.
Please could you also share the figures that you thought were in conflict.
It sounds like you need to use an Erlang Calculator
https://www.callcentrehelper.com/online-call-centre-staffing-calculator-77780.htm
I would suggest that you read this article first
https://www.callcentrehelper.com/how-to-work-out-how-many-staff-you-need-in-a-contact-centre-96591.htm
Good article,
Will you please explain (1) How do you identify those outliers? 6 sigmas? (2) Do you exclude those outliers from analysis (staffing calculation) or replacing them in “other values”?
I do not see forecasting here. Do we need it?
Please advise.