


Working out how many staff you need in a contact centre or BPO is a straightforward task, but it’s easy to make mistakes. A miscalculation can lead to long wait times, overworked agents, or unnecessary costs.
This guide breaks down the process into nine simple steps, helping you accurately determine staffing needs while avoiding common pitfalls.
9 Steps to Work Out Your Staff Requirements
We have condensed all the information that you need to make this headcount calculation into an easy-to-use, nine-step process, and we have also covered what you should NEVER do when making this calculation.
Step 1: Work Out the Incoming Call Volume Per Year, Month and Day
The first step in calculating your staffing headcount is to work out how many calls are coming into your business or BPO.
There are many ways in which you can work out the number of calls coming into the contact centre, but your method will depend on which sources of information you have access to and your call centre’s background. As there is a difference between inbound and outbound calls, the needs of your call centre will be different.
The following list considers this and presents you with a number of options that you can use to make the calculation.
- If you are part of an established call centre, you should be able to take an accurate calls-per-day figure from your call centre telephone system, commonly known as an Automated Call Distribution (ACD) system.
- If you do not have access to ACD results, your call-logging system and/or switchboard will provide a suitable alternative. This is commonly found in Call Detail Records (CDRs).
- Failing options a and b, a report from your telephone company may supply you with the relevant data if you are using managed numbers, e.g. 0800.
- Asking staff to manually log the number of calls coming into the contact centre is an option if you do not have any of the information above.
- If you were to track the number of accesses coming into the CRM system, this could also reflect the number of calls coming into the business.
If you cannot use any of the options listed above, you should make an estimate by following the procedure below.
Firstly, you will need to know the size of your customer base, the number of days your contact centre is open in a year and to make an estimation of the average number of times a customer will call each year.
For the example below, we have used the figures:
- Customer base: 30,000
- Number of calls each year, per customer: 2
- Number of days open each year: 250
However, these calls won’t arrive evenly across the year.
Break Down Annual Call Volumes Into Months, Weeks and Days
Look back at your previous call volumes. Break down your annual call traffic into percentages which represent how much of this annual traffic you tend to get every month.
For example, in a retail contact centre you may see a workload pattern like the one in the table below.
| Month | Percentage of Calls |
|---|---|
| January | 14.07% |
| February | 5.19% |
| March | 4.51% |
| April | 6.15% |
| May | 4.79% |
| June | 6.83% |
| July | 6.43% |
| August | 9.84% |
| September | 6.43% |
| October | 7.93% |
| November | 10.58% |
| December | 17.25% |
| Total | 100.0% |
By doing this, you can estimate monthly contact volumes from your annual forecast.
Then, again looking back through your old contact volumes, take this one step further by looking at each month individually. Consider:
- How do contact volumes fluctuate in this month?
- Are there holidays in these weeks that could impact contact volumes?
- Are marketing planning any promotions in this time?
By asking these questions, you can split your monthly contact volumes into weekly contact volumes.
But we are not finished there. You will also notice that certain days of the week are busier than others. Typically, for instance, Monday is the busiest day in the contact centre.
So analyse what percentage of your weekly traffic falls on each day.
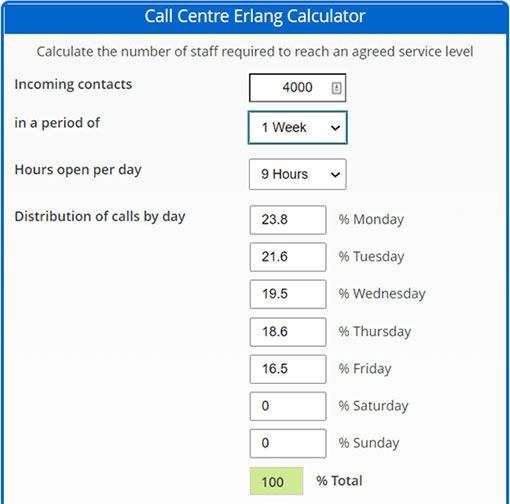
When you have done this, you can enter anticipated weekly contact volume, the number of hours you are open each day and those all-important percentages, into a trusty Erlang Calculator, like below.
Yet to achieve even better results, try breaking your contact volumes down even further.
Apply these percentages to your weekly contact volume and calculate daily volumes. Then move on to Step 2.
For more guidance and more complex methods for predicting contact volumes, read our article: A Guide to Workforce Forecasting in the Contact Centre
Step 2: Work Out the Number of Calls for Every 30 Minutes/Hour
Just as calls don’t arrive evenly throughout the week, they do not arrive evenly throughout the day.
So, use your forecast daily contact volumes – which you have calculated in the previous step – and forecast how many calls will arrive every hour or – better yet – 30 minutes.
There are two methods for doing this:
Option 1 – The Easy Way
This is easily done if you have an ACD system or a Call Detail Report (CDR) for your call centre.
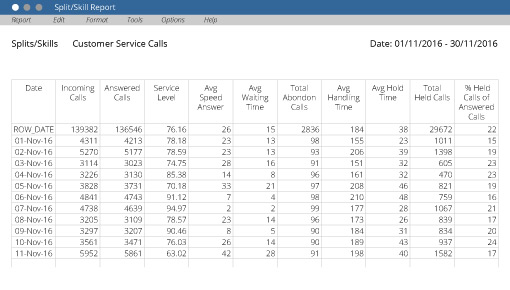
As you can see from the table above, your ACD system will be able to provide you with masses of information, including the number of calls that come into the contact centre over a defined period of time.
While the example given shows the daily report from the ACD system, it can also provide you with information for your desired time span. In this case, every half an hour or hour.
For more information on ACD systems, read our article: What to Look for When Buying an ACD System
Option 2 – The Harder Way
If you don’t have access to the information above, you can make an accurate estimation. This is best done by using a call-arrival pattern similar to the one below.
This pattern shows the profile of a contact centre’s demand across a typical day. You will need to create one of these for your contact centre.
To do this, analyse your contact volumes to find out what percentage of calls you receive across every half-hour or hour period on a typical day.
By doing so, you will create a set of results, just like in the table below:
| Time Interval | Percentage of Calls |
|---|---|
| 09:00 | 5.36% |
| 09:30 | 6.19% |
| 10:00 | 7.21% |
| 10:30 | 7.74% |
| 11:00 | 7.63% |
| 11:30 | 6.75% |
| 12:00 | 6.10% |
| 12:30 | 5.49% |
| 13:00 | 6.20% |
| 13:30 | 6.80% |
| 14:00 | 6.69% |
| 14:30 | 6.37% |
| 15:00 | 6.13% |
| 15:30 | 5.78% |
| 16:00 | 5.66% |
| 16:30 | 3.90% |
Use these percentages to create your call-arrival pattern and split your expected contact volumes for the day into 30-minute periods.
Step 3: Work Out Your Average Handling Time
Average Handling Time (AHT) is the average amount of time that a contact centre advisor spends on a call. This can be averaged out across the entire contact centre.
To calculate your contact centre’s AHT, use the following formula:
Average Handling Time (AHT) = (Total Call Durations + Total Wrap Times) ÷ Number of Calls Handled
You can find each of the inputs through your ACD system and call centre reporting.
However, if this information is not available, the next best thing would be to time customer–advisor interactions, including hold time, total talk time and wrap time, in different circumstances.
When you have done so, you should then add all the times recorded together and then use the formula above. This calculated figure will represent your AHT.
The calculated number will vary depending on which sector of business your call centre represents. This is reflected in a Call Centre Helper poll, which showed a great difference between the AHT of different companies.
From this poll, we discovered that 4.9 minutes (294 seconds) was the median AHT for contact centres.
So, if the two options discussed above are not for you, you can use this value when moving through the steps below or you can use the AHT of the sector that is most relevant to you.
| Sector/ Scale of Business | Average Handling Time (Seconds) |
|---|---|
| Large Business | 522 |
| Telecommunications | 528 |
| Retail | 324 |
| Business & IT Services | 282 |
| Financial Services | 282 |
[The figures provided in this table come from a 2004 Cornell University report “U.S. Call Center Industry Report 2004, National Benchmarking Report, Strategy, HR Practices & Performance] – Rosemary Batt, Virginia Doellgast, Hyunji Kwon
However, whilst AHT is important in this scenario, try not to assess your advisors against it. This is because if your advisors are too eager to get the customer off the phone to meet their targets, then perhaps they are not providing great levels of customer service. This may also result in the customer calling back.
For the full guide on calculating AHT, read our article: How to Measure Average Handling Time
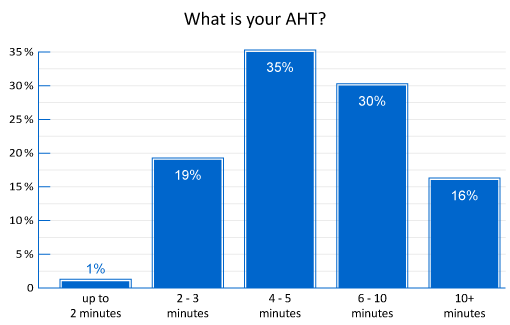
Step 4: Determine Your Service Level
The industry standard for service level has historically been to answer 80% of calls within 20 seconds. However, modern contact centres are moving towards 90% of calls answered in 10 or 15 seconds.
Yet it would be impossible for your call centre to reach a target of 100% service level, as this would require an infinite number of advisors.
The graph below highlights how an alteration in service level will cause a change to the number of agents that you should employ.
Ultimately, though, it is up to you to decide on a service level that keeps you competitive and does not involve recruiting too many advisors.
For more information regarding the typical service levels that contact centres target, read our article: What Are the Contact Centre Service Level Standards?
Step 5: Factor in Maximum Occupancy
Now we have set a service level, we need to recognize that agents cannot spend 100% of their time on the phone for extended periods of time.
This is where occupancy, the amount of time agents spend on the phone over the course of the thirty minutes, comes in.
Maximum occupancy is often a factor that is ignored in the process of calculating how many agents you need in the contact centre. This doesn’t make any difference in a small contact centre but is a major factor in why so many larger contact centres are understaffed.
To understand whether you need to take occupancy into account, you first need to set an occupancy target, just as you would for service level.

Instead of the earlier stated 100% figure, James Barnes, Director of Destructive Digital, believes that most contact centres have a more realistic occupancy rate.
“On average, my clients’ maximum occupancy ranges from 85% (in-house) to 90% (more performance driven),” says James.
Maximum Occupancy Should Not Be Set Higher Than 85% or 90%
James’s clients would have set an occupancy rate target of 85-90% to find the ideal mix of productivity and achievability. A higher than 90% occupancy rate would likely lead to agents picking up undesirable behaviours on calls, succumbing to burnout or the contact centre having increased attrition rates.
But how do you know what your occupancy rate is?
To calculate occupancy, you simply divide the number of erlangs (traffic intensity) by the number of agents on the contact centre floor and then multiply it by 100 to obtain a percentage occupancy figure.
But if every contact centre has an occupancy rate, why does it matter for large contact centres and not for those that are smaller?
This is because, when call volumes increase, so does the number of calls an advisor has to take in 30 minutes, meaning that occupancy gets higher and higher. This increase in the “staff workload ratio” is highlighted in the table below.
| Traffic Intensity (Erlangs) | Number of Staff Needed to Meet Service Level | Average No. of Calls Per Advisor (Staff Workload Ratio) | Occupancy Rate (%) | No. of Calls per 30 Minutes |
|---|---|---|---|---|
| 8.7 | 12 | 8.3 | 72.5 | 100 |
| 43.6 | 49 | 10.2 | 89 | 500 |
| 87.2 | 94 | 10.6 | 92.8 | 1000 |
The figures in this table have been calculated using an AHT of 180 seconds and a target service level of answering 80% of calls in 20 seconds.
What they show us is that at 1000 calls, the occupancy rate is 92.8%, which, although we encourage agents to be productive, just is not realistic.
So, just like service level, set a target, which would usually be somewhere between 85-90%, which can be entered into the Erlang calculator.
Step 6: Calculate Your Shrinkage
The information gathered in the previous five steps will allow you to work out the raw number of advisors needed to answer the phones in the call centre, but it does not take shrinkage into account.
Shrinkage is the amount of paid time that an employee is not available to do productive work, such as answer phone calls, despite being scheduled to do so.
There is both internal call centre shrinkage – where an advisor is in the call centre but cannot answer the phone – and external shrinkage – which is when an advisor is out of the call centre due to sickness, holidays, emergencies etc. Both need to be factored in.
Generally, shrinkage in the call centre accounts for 35% of staff who are not using the telephone at any given time.
However, this is just an industry standard, and it is important for you to accurately calculate your shrinkage in order to provide a precise number for how many staff you need.
Step 7: Work Out Your Average Patience
Also known as average time to abandon (ATA), average patience is the average length of time that a customer will stay in the queue before hanging up.
Many ACD systems will report on this figure but, for those unlucky few, the next best option is to create an abandon curve.
To do this, you will need to create a graph that plots the percentage of calls that abandon against time. An example is highlighted below.
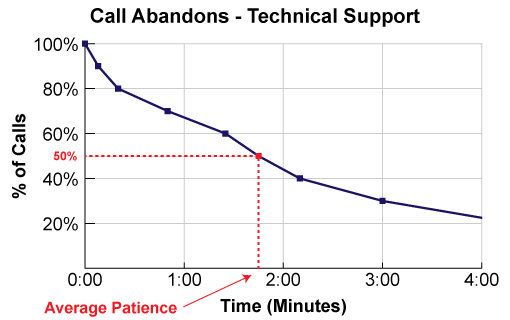
From this curve, you can spot the time within which 50% of your callers abandon. That time is your average patience.
This time is important, as – alongside, forecast contact volumes, AHT, service level, occupancy and shrinkage – it should be added into an Erlang Calculator to calculate the number of staff you need.
Step 8: Plug the Numbers Into an Erlang Calculator
By completing each of the steps above, you will have collected lots of information, which you can enter into our Online Erlang Calculator.
Call Centre Helper’s Erlang Calculator is better than most as it allows you to determine how many call centre advisors you need during each 30-minute period of the day, with specific reference to shrinkage, occupancy and average patience.
The example below shows the number of advisors calculated by our Erlang Calculator when:
- Reporting period = 30 minutes
- Average number of calls during the reporting period = 1000
- Average Handling Time/Average Call Duration = 180 seconds
- Required Service Level = 80% (industry standard)
- Target Answer Time = 20 seconds (industry standard)
- Percentage Shrinkage = 35%
- Target Occupancy = 85%
- Average Patience = 90 seconds
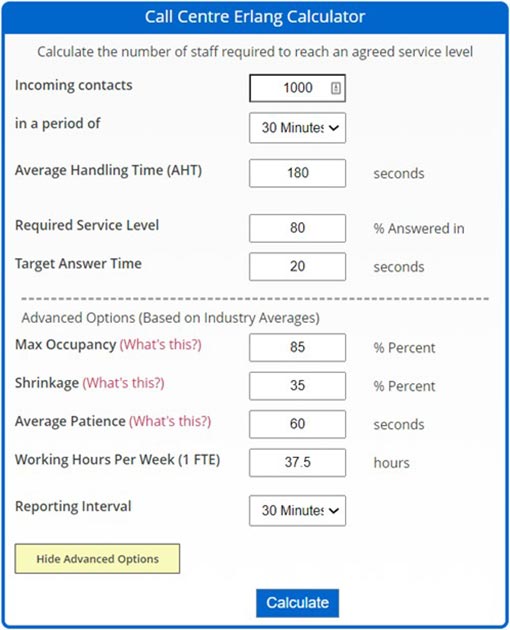
In this example, the Erlang Calculator determines that 182 agents should be deployed.
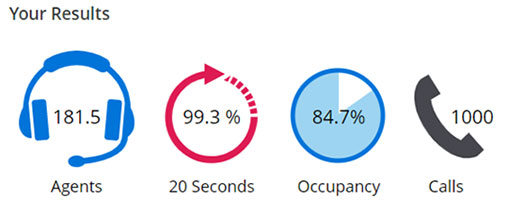
By doing this for every reporting period across the days, you can work out your daily headcount and start devising schedules to best meet demand.
If you would prefer to calculate staffing numbers in an Excel spreadsheet, we also have an Excel Based Erlang Calculator, which is very popular.
Step 9: Map Staff vs. Shift Patterns
While it is important for you to match the call-arrival pattern with the number of advisors available to answer the phones, it would be implausible to hire staff for 30-minute periods every day.
In order to match advisors against call volumes, there are a number of ways to ensure that you have an optimum level of advisors working in your contact centre. These include:
- Stagger break and lunch periods to ensure adequate coverage
- Use part-time staff to cover peak periods
- Hold team meetings during quiet periods
Adding a day planner to your staffing calculations, with help from the Erlang Calculator – Day Planner, will help you manage this.
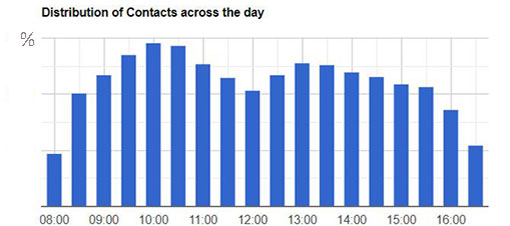
If you do this successfully, you will always have the optimum number of staff in your contact centre and they will be blocked around the call-arrival pattern, like in the graph below.
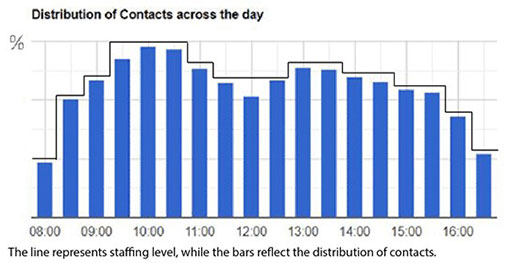
As you can see from this example, calls will tend to build up between 8am and 10am, with the busiest period of the day being from 10am to 12pm. This gives contact centres the ideal opportunity to stagger the start of agent shifts at the start of the day.
There are also many other shift patterns that you can experiment with.
These include:
- Rotational shifts: These help to balance the popular and unpopular shifts amongst your advisor population. They are, however, falling out of fashion because very few of us lead rotational lives.
- Fixed shifts: This shift type is a contractually agreed working pattern. Contact centres often use these in combination with part-time shifts to plug gaps in the schedule.
- Part-time shifts: Popular with students, parents and late risers, these shifts can add a huge amount of flexibility to the schedule.
- Split-shifts: When advisors work split-shifts, they effectively work two shifts with a gap of a few hours in between. These are popular in contact centres where call volumes plummet in the middle of the day and remote centres where the advisor doesn’t have to travel twice.
- Annualized Hours: This pattern requires your staff to work a certain number of hours every year, with more hours expected to be fulfilled during your busiest periods.
Experimenting with shift patterns like this, you can determine the best way to meet demand in your own contact centre.
To discover even more shift patterns that you can implement in your contact centre, read our article: The Best Shift Patterns for the Contact Centre
How NOT to Calculate Staff Numbers!
It is very important that you avoid the most common mistake in calculating staff numbers, because if you do not, you will be severely understaffed.
This mistake involves dividing the total number of call minutes by the number of hours in a day.
For this example, we have used the figures:
- 5,000 calls per day
- 3 minutes for Average Handling Time (AHT)
- 7.5 hours (the span of hours for which the call centre is open)
The process then follows as so:
- 7.5 x 60 = 450 minutes
- 450/3 = 150 calls per advisor per day
- 5,000/150 = 33 advisors required – this figure will leave you very understaffed.
However, this method does not consider factors such as:
- Call volumes varying across the day
- Callers may be waiting for a long time to get through to an advisor
- Holidays, sickness and meetings, etc.
- Advisor burnout
So, please avoid this method at all costs and instead follow our nine-step process above.
For more insights on staffing the contact centre, be sure to read our article: 10 Things You Must Know to Calculate How Many Contact Centre Advisors You Need
If you’re looking for more information on call centre staffing, read these articles next:
- A Beginner’s Guide to Managing an Intraday Plan
- Is Your Scheduling in Need of an Overhaul? Try These 8 Top Tips
- How to Change Your Shift Patterns – Without Losing Your Best Agents!
Author: Jonty Pearce
Reviewed by: Hannah Swankie
Published On: 21st Jun 2021 - Last modified: 6th Oct 2025
Read more about - Customer Service Strategy, Average Handling Time (AHT), Editor's Picks, Erlang Calculations, Full Time Equivalent (FTE), How to Calculate, Occupancy, Service Level, Service Strategy, Shrinkage, Staffing, Workforce Management (WFM)