

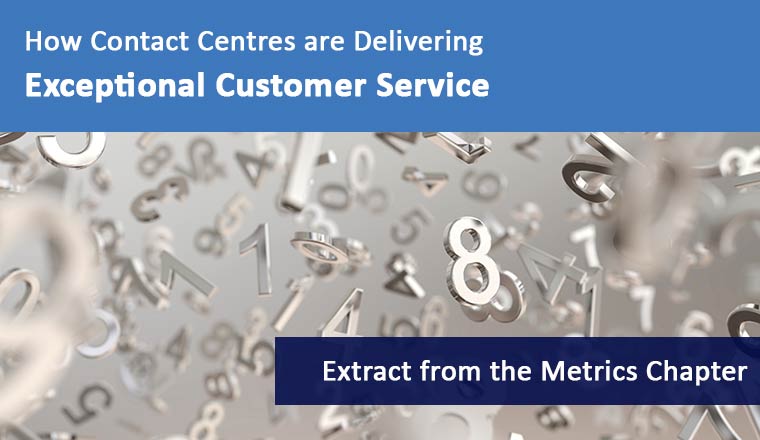

This article contains the extracted Metrics Chapter of the ‘How Contact Centres are Delivering Exceptional Customer Service’ 2020 survey report, which was sponsored by RingCentral.
The data that is included in this report was collected before the COVID-19 crisis took hold in many contact centre operations across Europe and the US
What Metrics are You Using to Measure the Performance of Your Customer Service Teams?
Contact Centres are Using Metrics to Put Unfair Pressure on Advisors
Shockingly, the most commonly used metric to assess team performance is Service Level (SLA), with 77.0% of contact centres using the metric in this way.
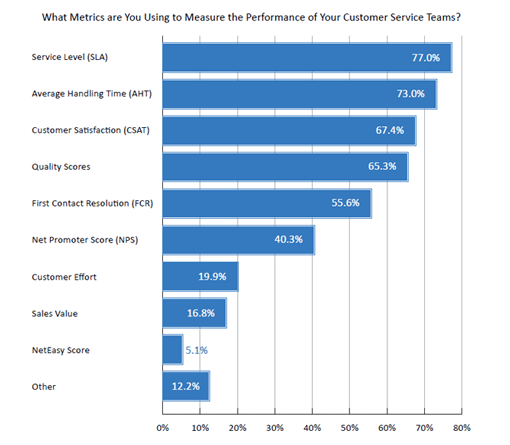
However, SLA should only be a target and measure for the WFM team, as it shows how successful they have been in predicting contact volumes and scheduling advisors against that forecast.
In addition to this, the second most widely used metric that’s used to measure the performance of customer service teams is Average Handling Time (AHT). This is again bad practice, as it can cause advisors to rush through calls, leading to lower First Contact Resolution (FCR) rates.
There are Many More Metrics Used to Assess Advisor Performance
While all of the classic metrics for measuring advisor performance were included in the chart above, 12.2% of contact centres also said that they were using “other” metrics.
When choosing the “other” option, participants were asked to tell us what those were.
Their responses included:
- Schedule Adherence
- Sales Revenue and Conversion
- Mystery Shopping Metrics
While each of these can be good metrics to assess performance, we did find other metrics being used for this purpose that really shouldn’t be. These included:
- Occupancy
- Utilization
- Abandon Rate
Once again, these are all metrics that should only be used by the WFM team; they should not be applied to the wider customer service team, because they have no control over them.
To Create Your Metric Scores, How Frequently do You Ask Customers to Complete a Post-Contact Survey?
38% of Contact Centres Ask for Feedback After Every Interaction
Well over a third of contact centres ask customers to complete a post-contact survey after every
interaction that they have with them.
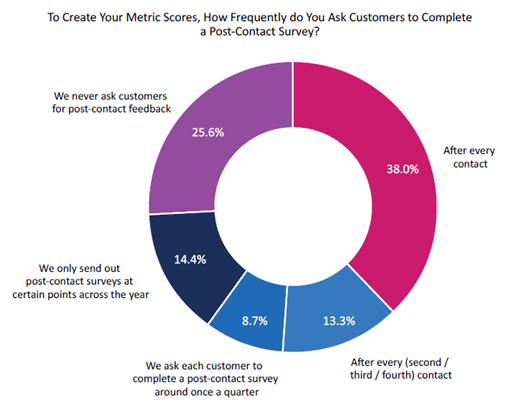
While it may only be a quick one-question survey to collect a CSAT or NPS score, the wider impact that this has on customer experience is questionable.
For example, if a customer were to call in twice in the same day regarding the same issue, how would they feel about being asked to complete the same survey twice?
It is for this reason that some contact centres now only survey customers after a certain number of contacts (13.3%), once a quarter (8.7%) or at certain points in the year (14.4%).
More Than a Quarter of Contact Centres Never Ask for Post-Contact Feedback
Another interesting finding from this chart is that 25.6% of contact centres never ask customers to complete a post-contact survey to create metrics scores.
This shows that contact centres may be growing more sophisticated in how they create certain metrics scores, whether that’s through a dashboard process or an analytics system.
In Your Contact Centre, How Have Attrition Rates Changed In the Last 12 Months?
Contact Centre Attrition is a Growing Problem
For the most part, the majority of contact centres (51.6%) reported that their attrition rates have remained “much the same” as they were 12 months ago.
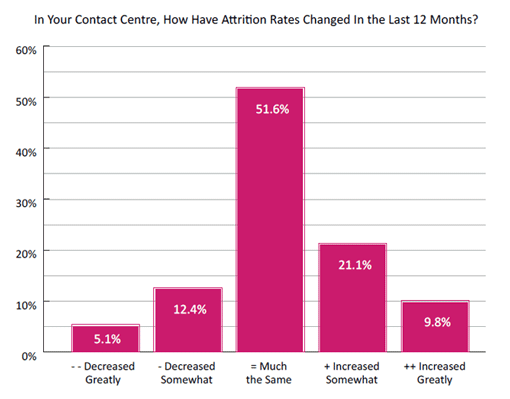
However, when we dig a little deeper, we can see that attrition figures are increasing in more contact centres than they are decreasing in.
In fact, attrition rates have increased in 30.9% of contact centres, whereas only 17.5% of contact centre reported decreasing levels of contact centre attrition in the past year.
Those contact centres where attrition is decreasing, however, are doing a very good job, considering the growing amount of career competition for young workers.
In Your Contact Centre, How Have Absenteeism Rates Changed In the Last 12 Months?
Contact Centre Absenteeism is Also on the Rise
The pattern of the chart below bears a striking resemblance to the attrition chart in the previous question and, in doing so, shows a worryingly similar trend.
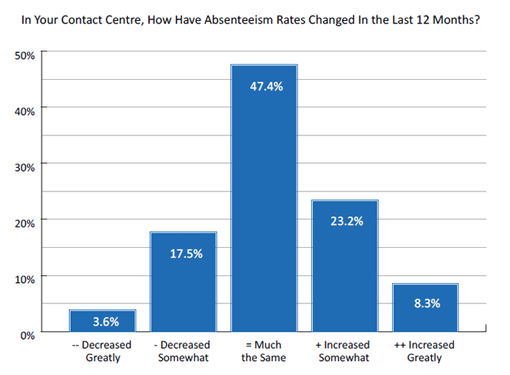
While the most popular response to this question was “much the same” (47.4%), we can see that the percentage of contact centres where absenteeism is growing outweighs those in which it is reducing.
In fact, 31.5% of contact centres reported increased absenteeism rates, as opposed to the 20.1% that have seen absenteeism fall in the past year.
There could be many reasons for this, and while many will be specific to certain contact centres, increasing absenteeism may be a sign of ineffective leadership, lack of engagement or advisor burnout – which is entirely possible if you’re measuring performance on metrics like Occupancy.
Download the full Call Centre Helper survey report ‘Is Your Contact Centre Delivering Exceptional Customer Service?‘ now.
Alternatively if you are interested in a specific chapter read one of these extracts next:
This survey was done in partnership with Jabra, NICE and RingCentral.
Related Research
To download the full copies of our ‘What Contact Centres Are Doing Right Now’ survey reports follow the links below:
- What Contact Centres Are Doing Right Now (2023 Edition)
- What Contact Centres Are Doing Right Now (2022 Edition)
- What Contact Centres Are Doing Right Now (2021 Edition)
- What Contact Centres Are Doing Right Now (2020 Edition)
- What Contact Centres Are Doing Right Now (2019 Edition)
- What Contact Centres Are Doing Right Now (2018 Edition)
- What Contact Centres Are Doing Right Now (2017 Edition)
- What Contact Centres Are Doing Right Now (2016 Edition)
- What Contact Centres Are Doing Right Now (2015 Edition)
You can also download the full copies of our ‘Is Your Contact Centre Delivering Exceptional Customer Service?’ survey reports by following the links below:
Author: Robyn Coppell
Published On: 17th Jan 2022 - Last modified: 16th Jan 2026
Read more about - Contact Centre Research, Benchmarking, Metrics, Research, RingCentral