


In our 2022 survey, we asked 294 contact centre professionals ‘What Is Your Mix of Contact Channels?’
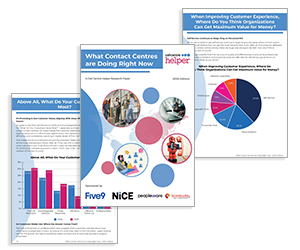
This article is an extract from our ‘What Contact Centres Are Doing Right Now’ 2022 survey report, which was sponsored by NICE.
What Is Your Mix of Contact Channels?
| Channel Option | Channel % |
|---|---|
| Voice (Inbound) | 53.5% |
| Voice (Outbound) | 14% |
| 17.8% | |
| Letters | 1% |
| Live Chat | 7% |
| SMS | 1.3% |
| Social Media | 2.8% |
| Video Chat | 0.6% |
| Other | 2% |
Voice Remains the Channel of Choice
67.5% of contact centre interactions are taking place over the phone, with voice remaining the most
popular channel of choice.
Despite this, inbound voice has reduced by 2.4% to 53.5% in the last year, whilst outbound voice has risen to 14% (the same percentage as 2016).
The reduction in inbound interactions could be due to a multitude of factors, such as improved resolution on other channels as well as channel availability.
Meanwhile, the increase in outbound interactions could result from agents calling customers back if they are unable to resolve their enquiries on other channels or arise from callback processes in the queue.
It is important to note that there is no guarantee that the volume of voice interactions demonstrates a preference for this channel, as if a customer can’t find their answers or resolve their queries in other ways, they will pick up the phone.
Over time, we would expect the volume of voice interactions to reduce as other channels become more popular and customers find it easier to get their resolutions, but it is worth keeping an eye on how customers are interacting with your businesses.
Email Could Be Bouncing Back
Last year email fell by 7%, but this year its use in contact centres has risen by 2.9% to 17.8%.
This suggests that last year may have been a temporary blip as a result of global conditions. However, only time will tell if email continues to grow, as other channels are increasing in use.
Social Media, Video Chat and Live Chat Gradually Grow
As contact centres improve their channel experience, we have seen a change in what customers are using for their interactions.
The use of social media has risen 21.7% to 2.8%, continuing the steady growth we have seen since 2018.
Similarly, live chat has continued to rise steadily in popularity, increasing just 1.4% in the last year, but an incredible 133.3% since 2015.
Video chat has also risen 100% to 0.6% of contact centre interactions this year, which is the most
significant growth we have seen in the channel for the last eight years.
The Decline of Letters Continues
Only 1% of contact centre interactions reportedly took place by letter this year. This is a drop of 9.1% from last year, and a continuation of the reduction in letter correspondence, which has fallen 80.8% since 2014.
This could be due to new channel options that allow for immediate resolutions, changing customer
demographics, or cost-reduction exercises as more correspondence is moved digitally.
This survey was done in partnership with NICE
Related Research
To download the full copies of our ‘What Contact Centres Are Doing Right Now’ survey reports follow the links below:
- What Contact Centres Are Doing Right Now (2023 Edition)
- What Contact Centres Are Doing Right Now (2022 Edition)
- What Contact Centres Are Doing Right Now (2021 Edition)
- What Contact Centres Are Doing Right Now (2020 Edition)
- What Contact Centres Are Doing Right Now (2019 Edition)
- What Contact Centres Are Doing Right Now (2018 Edition)
- What Contact Centres Are Doing Right Now (2017 Edition)
- What Contact Centres Are Doing Right Now (2016 Edition)
- What Contact Centres Are Doing Right Now (2015 Edition)
You can also download the full copies of our ‘Is Your Contact Centre Delivering Exceptional Customer Service?’ survey reports by following the links below:
Author: Robyn Coppell
Reviewed by: Jo Robinson
Published On: 27th Apr 2023 - Last modified: 15th Jan 2026
Read more about - Contact Centre Research, Benchmarking, NiCE, Omnichannel, Research