

Service Level Agreements (SLAs) are a critical part of running any contact centre, helping to set clear expectations for response and resolution times across every channel, from voice to social media.
But what does “good” really look like? Are your targets in line with wider industry standards? And how are other contact centres approaching queue times, response windows, and multi-channel service delivery?
Our research entitled “Is Your Contact Centre Delivering Exceptional Customer Service?“ which was based on data gathered from over 250 contact centres, offered some useful SLA benchmarks across phone, email, live chat, and social media. While the landscape continues to evolve, these insights provide a helpful snapshot of how SLAs are typically being set and managed.
In this article, we’ll explore those findings alongside current best practices to help you sense-check your own SLA strategy and ensure it’s still working for your customers, your agents, and your contact centre.
Contact Centre Service Level Standards
To help you get a clearer picture of what’s typical – and what’s possible – we’ve outlined common contact centre SLA targets across four key channels, including:
1. The Phone SLA
The Industry Average Remains at 80% of Calls Being Answered Within 20 Seconds
It is traditional for contact centres to target the SLA of answering 80% of calls within 20 seconds, and our research suggests many contact centres still stick to this standard.
From the bubble graph below, which captures the responses of our 250+ contact centre professionals, we can see that the largest cluster forms around the 80/20 mark.
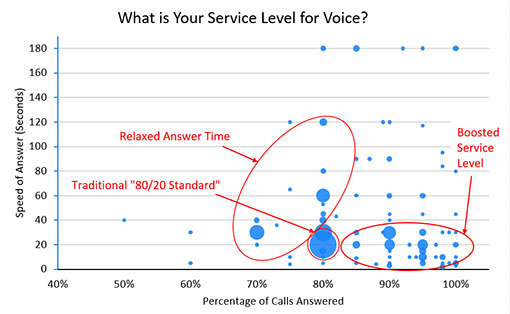
However, while this is indeed the case, there is a great deal of variation in and around this cluster, which seems to suggest that many contact centres are moving away from this conventional standard.
In fact, when you look closely at the graph above, there appears to be two schools of thought about moving away from the 80/20 standard. There are those who relax their target time and those who boost it to a higher percentage.
Relaxed Answer Time
We can theorize that many contact centres are relaxing their SLA because the second and third “bubbles” in the graph are clustered around the 70/20 and 80/60 data points.
But, at a time when we are being told that customer service is becoming a key service differentiator, why are some contact centres happy to make their customers wait a little longer?
Well, firstly, there are the obvious cost benefits, in that you’ll likely need fewer advisors to be taking calls if you staff to a lower SLA.
But these contact centres might have also investigated how varying their SLA impacts their customer satisfaction. If they found low correlation between the two metrics, there is a business case for lowering SLAs.
If you were to do this, though, it is also important to look at the impact service level has on your abandon rate, to ensure that you won’t “lose” too many calls.
For more on the relationship between SLAs and CSat, read our article: Is There a Correlation Between Queue Time and Customer Satisfaction Levels?
Boosted Service Level
While there is a clear pattern in contact centres relaxing their service level, there is a trend in contact centres doing the opposite as well. This is highlighted by the great number of small bubbles scattered around the bottom right of the graph above.
Having such variance perhaps shows that contact centres are doing more research into their own customer base and how both CSat and abandon rates vary as they adjust their service level.
This is good news as it suggests that contact centres are examining the customer experience more closely, instead of just taking traditional industry conventions at face value.
Also, customers in different sectors would expect wait times to differ accordingly. For example, a customer phoning a technical support number will likely expect to wait much longer than someone calling a retail line.
So, what many contact centres are likely doing is plotting their abandon rates against their SLA to form an abandon curve. They then set an “abandon ceiling” of between 2 and 5%, depending on CSat and brand values, and staff to an SLA according to this research.
To find out more about this process, read our article: What Is an Acceptable Contact Centre Waiting Time?
2. Email SLA
The Industry Average Is to Answer 100% of Emails in 24 Hours
Away from the phone channel, other channels don’t have a long-standing “standard” service level that is seen as the traditional option. This is primarily because digital channels haven’t been around as long.
However, email is a channel that has been around for long enough so that common SLA options have started to emerge, as highlighted in the bubble graph below.
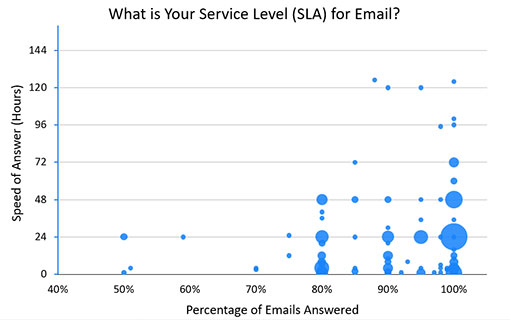
Our findings reveal that the most common SLA for contact centres to opt for is answering 100% of emails within 24 hours. However, there were also smaller “bubbles” for this time at 95%, 90% and 80%.
While there is also a cluster forming near the 100% of emails answered in three hours mark, it is surprising to see more contact centres waiting 48 hours to complete the same percentage of emails.
In fact, there were a number of contact centres taking over 48 hours to respond to emails, which may well be causing a number of repeat contacts and damaging First Contact Resolution (FCR) rates.
The danger with waiting more than a few hours to respond to an email is that the customer may become frustrated and decide to solve their issue through another channel – creating duplicate contacts. This isn’t good for the customer or the contact centre.
So, while we cannot develop a service level through examining abandon rates on the email channel, we can examine the relationship between email service level and repeat contacts, as well as CSat.
The Best Contact Centres Are Targeting Less Than Four Hours
Yet, we shouldn’t just focus on the negatives, as it was great that our research found a significant number of contact centres targeting a wait time of less than four hours.
In fact, if we dissect the data further, 13.9% of contact centres are setting a target of handling emails in one hour and 35.4% are targeting less than four hours.
This statistic, combined with the fact that some contact centres wait for over three days to respond to 100% of customer emails, highlights the great variance across the contact centre industry.
However, this wide variance does not only apply to the email channel, it is common across the digital channels…
3. Live Chat SLA
The Industry Average Is to Answer 80% of Chats in 20 Seconds
As expected, as live chat is much more modern than the two channels previously discussed, our research fails to highlight a clear industry standard SLA for the channel.
However, the largest “bubble” does seem to form around the data point where 80% of live chats are answered in 20 seconds – with many contact centres applying the traditional industry standard for the phone to live chat.
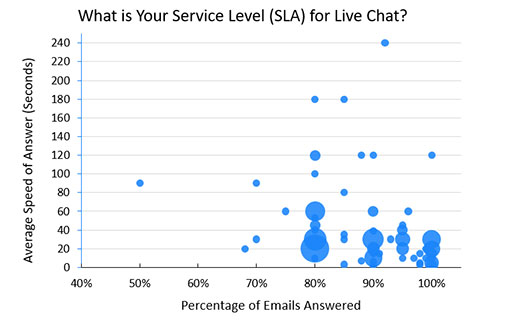
This SLA underlines live chat’s proposition as a written channel from which customers can expect an immediate response, so the contact centre can provide more choice for eager customers, rather than “forcing” them to pick up the phone.
The SLAs of almost every contact centre with live chat surveyed shared this notion, with many picking slightly different, but similarly speedy, targets.
For example, 30 seconds appears to be the most common target wait time, with the two next biggest clusters – after the 80/20 standard – forming around the 90% and 100% mark at this time period.
In fact, while we say that 80/20 is the standard because it was the most common response, if we form an average from all of the data included in the chart above, the average service level for live chat seems to be answering 90% of chats in 30 seconds.
Be Careful When Looking to Improve Service Level on Live Chat
While contact centres look to target low response times when it comes to live chat SLAs, we need to be careful about how we do so, as there are still many misconceptions around live chat.
One common example is that advisors can handle three or more chats at once. While this may be true in some environments, in others it can cause advisor burnout and/or long delays in between messages, which can be frustrating for the customers.
So, don’t try and “hit” your service level target by boosting concurrency, as one other thing that is important to remember is that handling times increase with concurrency, so the “efficiency” benefits that you think you may be achieving may not be quite so accurate.
To find out more misconceptions around live chat, read our article: 10 Things They Won’t Tell You About Live Chat
4. Social Media SLA
The Industry Average Is Difficult to Define
The social media channel was the most difficult to make an assumption of the industry average SLA, as the chart below shows a great variance between contact centres.
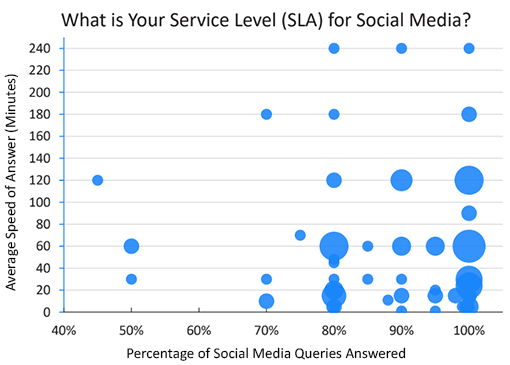
Such variance is likely due to varying perspectives of the channel. Some would argue that social is more of an informal channel, so it carries less significance, while others may say that because social brings an “audience” to the customer’s issue, it’s vital to provide a quick response.
The biggest circle does appear to be located at the mark of responding to 100% of social media queries in 60 minutes – so, if pressed, we could label that as the industry standard.
However, by drawing this conclusion, we are conforming to the notion that it’s vital to provide a relatively quick response, while a lot of contact centre professionals appear to believe that this is not the case.
Social Media: Is a Quick Response Really Necessary?
While the customer wouldn’t expect an immediate response to their social media post, prospective customers are influenced by negative posts online, so we do want to respond to them systematically.
We can do this by setting a strict SLA, which is likely why the vast majority target an SLA of 100%, no matter the Average Speed of Answer (ASA). This helps to ensure that no piece of online commentary slips through the cracks.
But while this is a key trend, the ASA varies dramatically from five minutes to four hours, with many different targets in between. Whichever option you choose, it will likely reflect your brand image.
If you are part of a brand that prides itself on good customer service, you’ll target a low ASA for the social media channel as a key priority. However, a brand that instead views the contact centre as a “cost centre” will be more content in relaxing that ASA.
While costs and CSat will be key factors in your SLA decisions, regardless of the channel, brand image is a key fact that we must not forget.
Typical Contact Centre SLA Targets – and Why They Might Not Be Right for You
Through our research we found that the industry standard service levels for the following channels are:
- Phone: 80% of calls answered within 20 seconds
- Email: 100% of emails answered within 24 hours
- Live Chat: 80% of chats answered within 20 seconds
- Social Media: N/A
However, there was a lot of variance across each channel, which indicates that brands are undertaking research to find the best SLA for their own customer base.
In future research, we plan to find service level standards for letters and SMS/messaging apps also.
For now, we could estimate that common SLA choices for these channels would be:
- Letters – 95% of letters answered within three days
- SMS/messaging apps – 80% of messages responded to within 20 seconds
But, given the spread of SLAs across each of the channels examined in the article, we would hesitate to do so.
After all, the most common theme that we have uncovered in this article is that there is a great amount of variance in SLA targets across the board.
Just try to examine abandon/disengagement rates and CSat as your ASA varies. This will provide you with some really useful insights to help you make your own SLA decisions, for the good of your contact centre.
For more on the service level metric and wait times, read our articles:
- How to Calculate Contact Centre Service Level
- What Is Causing Your Service Levels to Fail?
- Waiting Time: What Is Best for Your Customers?
Author: Charlie Mitchell
Reviewed by: Jonty Pearce
Published On: 21st Aug 2019 - Last modified: 13th Aug 2025
Read more about - Workforce Planning, Editor's Picks, Key Performance Indicators (KPIs), Metrics, Service Level, Workforce Planning