


In today’s fast-paced world, customers expect quick and efficient service, making call centre waiting times a critical factor in customer satisfaction.
As discussed in our article “What Are the Industry Standards for Call Centre Metrics?“, the traditional wait time for contact centre customers is 20 seconds. This gives the metric for the Average Wait Time (AWT).
In fact, it is conventional for call centres to aim to answer 80% of their calls in 20 seconds. But should we perhaps start to think about shortening or perhaps even lengthening this wait time?
Is there a standard that businesses should aim for, or does it vary based on factors like industry, brand, and customer expectations?
5 Approaches to Determine the Ideal Call Centre Wait Time
We have put together five different ways to figure out the best call centre wait time, based on what works for your business, your customers, and your brand.
1. Stick to the Traditional 80/20 Measure
Although the “industry standard” suggests answering 80% of calls within 20 seconds, this average call wait time may not be suitable for every industry. Customers for different products or services may have varying levels of patience when it comes to wait times.
In our article “How to Bring Down Your Call-Abandon Rates,” we compared abandonment rates between sales and technical support contact centres. The findings are shown in the graphs below.
Sales Contact Centre Abandon Rates
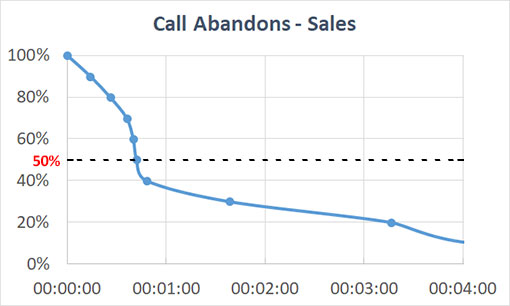
In this contact centre, over 50% of callers abandoned after 45 seconds of waiting.
Technical Support Contact Centre Abandon Rates
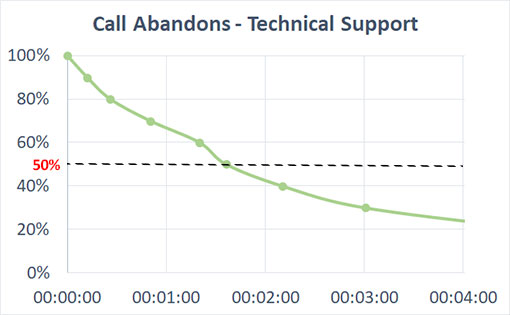
In this contact centre, over 50% of callers abandoned after 95 seconds of waiting.
2. Use Your Abandon Rates to Guide You
As shown in the graphs above, your abandon rates may help to inform you when is best to set your target wait time.
Some contact centres set an “abandon ceiling” between 3% and 5%. Once you choose a percentage, you can calculate an appropriate queue time based on your customer base. This can be done by plotting the percentage of abandoned calls against time, as shown in the graphs.
For example, if you set a 5% abandonment ceiling, you can identify the average wait time at which 95% of customers are still waiting in the queue.
Kevin McAteer, one of our readers, also believes that the key to finding an acceptable average wait time for your contact centre is in your abandon rate metrics.
“Take a look back at your abandon rates and work out what the Average Time to Abandon is. That may give you a starting point to address the core problem for your own environment – an abandoned call is an unhappy customer and potential lost revenue.”
However, you also need to factor in Customer Satisfaction (CSAT). Look to see if there is any correlation between CSAT and wait time, by plotting the two metrics against one another on a separate graph.
If you find CSAT is higher when queue time is based on an abandon rate of 3% instead of 5%, reduce it further. However, if the difference is minimal, it might not be worth the extra resources required to meet that service level.
For more on this topic, read our article: Is There a Correlation Between Queue Time and Customer Satisfaction Levels?
3. Consider Your Brand Identity
Some organisations use customer service as a competitive differentiator, and if you belong to such a contact centre, you may want to consider shortening your call centre hold time standards.
“It all depends on what image you want to give to your customers and whether you want to differentiate yourself from the competition through service.
Personally, if it takes more than three rings before someone answers my call I start wondering whether I have placed my business with the right company.
While I’m not seriously expecting you to meet every call in three rings, what really counts when it comes to service is: keeping wait times and abandonment rates to a minimum, keeping levels of IVR to a minimum and that the customer gets to speak to someone who is professional and trained to help them with their enquiry.” – Janette Coulthard
So, if you are part of an organisation that prides itself on outstanding customer service, consider lowering wait times from the average hold time in your call centre to 20 seconds.
Or, if you use abandon rates to deduce an average call wait time, consider lowering your abandonment rate “ceiling” to below 5% and find your new wait time in that way.
4. Relax Your Service Levels
So, that’s the case for shortening queue times, but why would you consider relaxing them?
The obvious benefit is to save resources, but some also believe that it could be in the best interests of the customer.
While this may sound counterintuitive, doing so can relieve the strain on advisors and encourage them to go the extra mile for the customer.
While this may sound counterintuitive, doing so can relieve the strain on advisors and encourage them to go the extra mile for the customer.
“In general, we’re seeing Average Speed of Answer (ASA) and service level targets actually increase in a lot of organisations, from the previously typical 20 seconds to 50 or 60 seconds.
These organisations have found that the difference in dissatisfaction levels between somebody who is answered in 20 seconds compared with somebody who has to wait 60 seconds is negligible, while the cost of achieving the former during peak times is significantly higher.” – Stuart Lambert
While this could offer some organisations plenty of savings in resources, many would question whether it damages customer service by increasing abandon rates. However, Stuart is a fan of reducing abandon rates in other ways:
“Providing callers with an accurate expectation about how long they should be expected to wait, along with respectful alternatives to waiting on hold – such as offering call-backs to those waiting in the queue – all help reduce abandon rate.”
Research Shows Little Correlation Between Wait Time and Satisfaction
While many will still question whether lengthening wait time is in the best interests of the customer, research from Vocalabs indicates that acceptable hold time customer service have a minimal impact on CSat, as long as they aren’t too long.
In fact, Vocalabs’ survey into contact centres in the banking industry found that customers were willing to wait for up to 2–3 minutes and that CSat was not significantly impacted until wait time surpassed 4–5 minutes.
These findings have been backed up by an Australian call centre, which decided to prolong its wait times massively, from <15 seconds to 240 seconds. In doing so, it saved 15% in resources and saw no negative impact on its NPS scores.
“You don’t have to go to such an extreme, but consider relaxing a little bit around the traditional 80/20 service level, as it might not be the right ambition to achieve. Taking the time to route customers to the right skills would seem to have a greater impact on satisfaction and NPS.” – Mike Murphy
5. Offer Different Wait Times for Different Customers
Adding flexibility to contact centre wait times has another benefit of ensuring high-value calls are answered more quickly than others, according to Stuart Lambert:
“From the contact centre’s point of view, queues can be good: they keep staff occupied and afford the opportunity to offer a differentiated level of service to those customers you value the most by answering them more quickly than others.”
If your contact centre segments its customer base into high-value and low-value customers, having different wait times and routing strategies is an interesting idea.
“If you have VIP clients, we should remember that they are VIP clients for a reason and they should be treated accordingly. But if you relax a little bit around the rest of the contacts and instead focus on routing calls through to the right skills, through predictive routing, you can improve CSat in that way.
Don’t feel that you have to drive for the 80/20. If you do, you’re putting stress on yourself and you may route the call incorrectly, and while that might meet your measure, you’ll more likely create a poor customer experience, as the most appropriate advisor is less likely to take the call.” – Mike Murphy
As always, the key here is to try to match your level of service with the overall experience your customers expect. Decreasing wait times for high-value customer is certainly an interesting approach to take.
What About Channels Other Than Voice?
Wait time does not only apply to inbound calls. However, for live chat – another channel where the customer has to wait in a queue – the same principle of setting a target wait time that is based on abandon rates applies.
For other channels, such as email, letters and social media, a delayed response is to be expected. This delay will likely vary across different industries, though.
So, we’ve done our research and found service levels across these three channels, which seem to be the average across different industries.
- Email – 95% of emails answered within four hours (the better contact centres are aiming to respond to 80% of emails within 15 minutes)
- Letters – 95% of letters answered within three days
- Social media – 80% of contacts answered within 20 minutes
- Live chat – 80% of chats answered within 40 seconds
- SMS/messaging apps – 80% of messages responded to within 40 seconds
For more articles on wait time and service levels, here’s some additional reading:
- Waiting Time: What Is Best for Your Customers?
- How Do I… Reduce Call Queuing Time?
- How to Predict Call Abandon Rates Based on Service Level
Author: Charlie Mitchell
Reviewed by: Robyn Coppell
Published On: 26th Nov 2018 - Last modified: 22nd Jan 2026
Read more about - Call Centre Management, Average Speed of Answer (ASA), Charlie Mitchell, Genesys, Janette Coulthard, Management Strategies, Metrics, Mike Murphy, Queues, Service Level