

Call centres rely on key metrics to track performance, efficiency, and customer satisfaction. These benchmarks help determine whether service levels are being met and where improvements are needed.
But what are the industry standards for these metrics, and how do contact centres compare?
In this article, we break down some of the industry standards for key metrics, while giving two ideas for how contact centres can reach and surpass them.
7 Key Call Centre Metrics and Their Industry Standard Benchmark
Here are seven key call centre metrics that play a crucial role in measuring performance and customer satisfaction:
Keep reading as we break down each metric in detail, explaining its importance, industry expectations, and how to optimise it for better results.
1. Service Level
Service Level is used to measure the percentage of calls answered within a set time, helping assess responsiveness and manage customer wait times.
What is the Industry Standard for Service Level?
The Call Centre Industry Standard Metric for Service Level is 80% of calls answered in 20 seconds
The traditional service level in the contact centre is to answer 80% of calls in 20 seconds. However, over recent times, many contact centres have made an effort to improve service levels by attempting to answer 90% of calls in 15 seconds.
These results were uncovered in a 2019 Call Centre Helper Survey and are well depicted in the graph below.
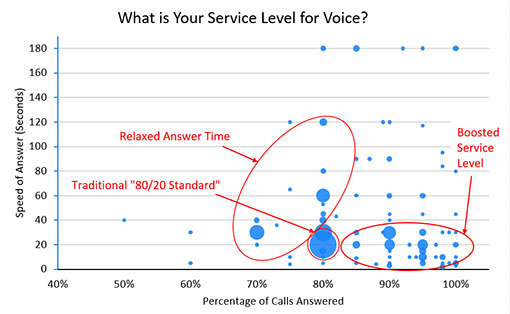
In these findings, we can also see that there are some contact centres that are willing to let customers wait a little longer in the queue, to focus on giving them the best possible service once they reach an advisor.
So, while not everybody is sticking to the 80/20 service level standard, some contact centres are tightening there service level targets, while others are relaxing them.
Service Level Standards Across Channels
Check out the table below for common Service Level (SLA) industry metrics across channels in the contact centre:
| Channel | Service Level Metric |
|---|---|
| Phone | 80% of calls in 20 seconds |
| 100% of Emails in 24 Hours | |
| Live Chat | 80% of Chats in 20 Seconds |
| SMS / WhatsApp / Messaging Apps | 80% of messages responded to within 40 seconds |
| Letters | 95% of letters answered within three days |
While we have highlighted the traditional service level for the voice channel, what about the conventional service levels for other contact centre channels?
Original Call Centre Helper research – as covered in great detail in our article: “What Are the Contact Centre Service Level Standards?” – uncovered the following industry standards for service level.
- Email – 100% of Emails in 24 Hours (the better contact centres are aiming to respond to 80% of emails within 15 minutes)
- Live Chat – 80% of Chats in 20 Seconds
- Social Media –The Industry Average Is Difficult to Define
In addition to these results, the article also estimates industry standards for service level across other contact centre channels, including:
- SMS/Messaging Apps – 80% of messages responded to within 40 seconds
- Letters – 95% of letters answered within three days
Yet, just because we – as an industry – are setting these service levels, that doesn’t necessarily mean that we are meeting them.
To better meet these standards though, there are a couple of things that you can do…
Two Ways to Ensure That The Service Level Standard Is Met
Take on the Most Challenging Part of the Day First
Be aware of that period where the projected contact volumes are at their very worst by ensuring that the contact centre has a proactive view of the day ahead.
Look to balance your competing workloads and don’t attempt to staff to each individual peak. Instead, use the time afforded by the proactive view of the day to consider contact deflection solutions, IVR messaging and channel prioritisation.
Plan for the Long Term, Not the Short Term
Don’t trade off short-term gains for long-term pain when scheduling staff to meet the target service level.
If the proposed solution makes things better across five channels but will result in two weeks of pain in the back-office area, consider another solution!
For more advice on setting and achieving service level targets, read our article: Is 80/20 Still a Reasonable Service Level?
2. Quality Assurance (QA) Scoring
Quality Assurance (QA) Scoring is used to evaluate agent performance based on predefined criteria, ensuring consistent service and adherence to standards.
What is the Industry Standard for Quality Assurance (QA) Scoring?
The Call Centre Industry Standard Metric – Random scoring of four advisor calls per month (quality score would ordinarily fall between 75 and 90%)
It has become accepted within the industry that most contact centres score one or two advisor–customer interactions every week.
However, it appears that many contact centres are failing to even do this, with 41% monitoring fewer than four calls every month. This is according to our research, which is highlighted below.
Two Ways to Surpass the Quality Assurance (QA) Scoring Standard
Run Peer Feedback Sessions
Most contact centres would do more random scoring of calls, but they struggle to find the time for call analysts to do so. This often leads contact centres to ask the team to score the calls of one another.
One particularly good way to do this is to get a team member to quality score calls every week and give their peer feedback.
The contact centre should then rotate the role, meaning that a different advisor from each group of 8–12 advisors would take up the role the following week. Then, after 8–12 weeks, the first advisor would score calls again.
This initiative is a great way to build a culture of coaching, as is further discussed in our article: How to Create a Coaching Culture in the Contact Centre
Use Interaction Analytics to Automate Scorecards
The best-in-class quality programmes score 100% of interactions against multiple, predefined criteria and categories. Interaction analytics allows contact centres to do this.
The presence of certain language, and other key metrics, are combined into a scorecard that measures various performance indicators, such as: advisor quality, customer satisfaction, emotion and compliance risk.
By automating scorecards, the contact centre can provide accurate and objective feedback to advisors, so they can improve their own quality. Scorecards can also be used by supervisors to personalise training and coaching for advisors to improve quality further.
3. First Contact Resolution (FCR)
First Contact Resolution (FCR) is used to track the percentage of customer issues resolved on the first interaction, indicating the effectiveness of service.
What is the Industry Standard for First Contact Resolution (FCR)?
The Call Centre Industry Standard Metric for First Contact Resolution (FCR) is 70 – 75%
Generally, the industry benchmark for FCR is between 70 and 75%. However, there are many different ways to measure FCR, and percentages will likely change depending on the method you use.
This makes it impossible to accurately benchmark FCR across the contact centre. Also, as soon as there is a slight difference in channel mix, the metric becomes even more difficult to compare because there is a completely new set of circumstances to think about.
For more on the methods to measure FCR, read our article: How to Calculate First Contact Resolution
Two Ways to Surpass the First Contact Resolution (FCR) Standard
Find Individual FCR Rates for Different Call Reasons
It is all well and good to have a generic FCR score, but if a contact centre were to create an individual score for each of its top ten contact reasons, it would gain more actionable insight. This is because the contact centre can get more of an indication as to which call reasons advisors are struggling to handle and which are causing the most trouble for customers to come to terms with.
Once this becomes clear, the contact centre can focus on those call reasons by improving advisor process guides, improving website navigation and so on, in an bid to focus their efforts on where best to boost FCR rates.
Connect Customers to the Most Appropriate Advisor
Skill-based routing, which identifies caller ID and passes customers through to the most appropriate advisor, can help to reduce the number of escalations needed to handle a customer’s query.
If the contact centre were to have a strategy in place that passed customers through to the most appropriate advisor, the chances of FCR will likely improve greatly.
These strategies may include data-directed routing, where calls would be routed to the most appropriate advisor depending on the customer’s status. For example, a customer with an overdue account would be passed through to an advisor in the payments department.
To find out more call routing strategies like these, please read our article: The Top 10 Call Routing Strategies
4. Average Handling Time (AHT)
Average Handling Time (AHT) is used to calculate the average duration of customer interactions, helping manage efficiency without affecting service quality.
What is the Industry Standard for Average Handling Time (AHT)?
The Call Centre Industry Standard Metric for Average Handling Time (AHT) is 6 minutes and 3 seconds (based on 190,702 entries into our Erlang Calculator)
Taking data from the 190,000+ entries made into our Erlang Calculator, the industry standard for AHT is a little over 6 minutes. Yet this will vary greatly depending on the sector/scale of business.
A Cornell University report made this point clear when comparing the AHTs of different types of contact centres. The results can be found in the table below.
| Sector of Business | Average Handling Time (seconds) |
|---|---|
| Telecommunications | 528 |
| Retail | 324 |
| Business and IT Services | 282 |
| Financial Services | 282 |
Two Ways to Surpass the Average Handling Time (AHT) Standard
The goal of many contact centres is to reduce AHT, to maximise efficiency. However, this can have a negative impact on service quality.
So, here are two ways to lower AHT that will not influence service quality.
Create Cheat Sheets to Streamline Calls
Often, the contact centre will find that its advisors use different methods to elicit the same information from their customers. This is both in terms of call-handling techniques and system navigation.
By analysing these methods, the contact centre can put together cheat sheets that encourage advisors to use the method that has best impact on Customer Satisfaction (CSat) and proves the most efficient.
This tip was given to us by Mark, one of our readers, and is also part of our article: 49 Tips for Reducing Average Handling Time
Record All Calls to Find Training Issues
Recording all calls will enable the contact centre to pay special attention to both long and short calls to identify if there has been a training issue.
Understanding the reasons behind high hold and after-call work times will provide better insight into managing the handling time.
The key to AHT is quality. If the contact centre ensures that its advisors are providing a quality service, AHT will take care of itself.
Another way to improve AHT would be to use a technique called “signposting”. To find out more about this, read our article: Signposting – A Technique for Reducing Your AHT by 15 Seconds
5. Net Promoter Score (NPS)
Net Promoter Score (NPS) is used to measure customer loyalty by asking how likely customers are to recommend a company, reflecting overall satisfaction.
What is the Industry Standard for Net Promoter Score (NPS)?
The Call Centre Industry Standard Metric for Net Promoter Score (NPS) is better than ten
Generally, any NPS score above zero would be considered “good”. But below zero is an indicator that the company needs to start understanding and improving customer satisfaction levels.
While this is considered to be the industry standard, NPS scores can vary greatly from business to business, with figures ranging from -100 to 100.
Find out how to measure NPS in our article: How to Calculate… Net Promoter Score
Two Ways to Surpass the Net Promoter Score (NPS) Standard
Focus on What Detractors Are Saying
Focusing on the factors of customer service that are constantly repeated by detractors is a key priority. This is because they may not only be giving the brand a bad reputation, but having a detractor-led focus makes it easier to find areas of failure demand and unnecessary operational costs.
There may also be a chance that the organisation as a whole may be attracting the wrong type of customers, whose needs they may not be able to satisfy. Detractor feedback may be able to highlight this.
But remember that detractor feedback should be collected to guide strategies that help to drive improvements in NPS. Try to stay focused on these strategies because the actual “score” isn’t what matters, it’s what the contact centre does with that score to attract promoters.
Avoid Working in Silos – Where Possible
If a customer calls with various different issues, contact centres should allow an advisor to handle as many of these queries as possible, without transferring to another department.
Where a transfer is unavoidable, always make a ‘warm’ handover and consider the priorities given to internal transfers in the contact centre’s call-routing strategy.
Customers who have already got through to the contact centre will find further delays more irritating and will be less likely to accept prolonged hold and queue times. This will damage satisfaction and consequently lower the chances of a customer reference.
Find more tips like these in our article: 16 Ways to Improve Your Net Promoter Score
6. Shrinkage
Shrinkage is used to calculate the percentage of paid agent time lost to breaks, training, or absences, assisting with workforce management.
What is the Industry Standard for Shrinkage?
The Call Centre Industry Standard Metric for Shrinkage is 30%
In most of the contact centres that we visit, shrinkage – the percentage of time that an advisor is unable to take customer contacts – is usually calculated to be around 30–35%.
However, the average figure that is entered into our Erlang Calculator is 26.6%, which might indicate that there is widespread confusion over the definition of shrinkage and/or how to calculate the metric.
Two Ways to Surpass the Shrinkage Standard
While there are many elements of shrinkage that are outside of the contact centre’s control, like holiday time, system downtime and certain meetings, the contact centre can reduce shrinkage by boosting productivity and lowering absenteeism.
Provide Advisors With Access to Their Own Performance Statistics (Increase Productivity)
One way to improve productivity would be to give advisors access to quality scores, or other relevant metrics results, directly to their desktops.
If you do this, advisors can not only receive direct feedback on how they can improve performance, but it may also inspire the team to be more productive and boost their scores – especially if incentives are linked to their results.
HomeServe’s contact centre directs the Customer Effort Score (CES) that the customer gave the advisor during a post-call IVR survey to the relevant advisor’s desktop. This result is then paired with feedback from the company’s speech analytics system, giving advisors the information they need to self-learn the techniques and approaches that can be used to minimise customer effort.
Try Out an Annualised Hours Scheduling System (Lowering Absenteeism)
If an annualised hours scheduling system is implemented in the most effective way, contact centres can limit overtime costs, reduce the cost of temporary resources and reduce absenteeism.
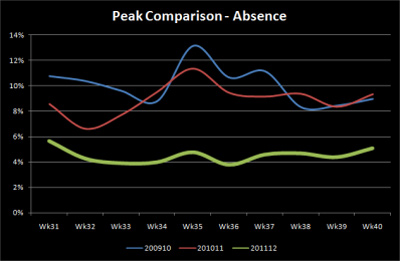
In fact, when Knowhow, the delivery and installation service, applied this scheduling scheme in its contact centre, it lowered sickness by as much as 8%, as seen below. It also helped to lower attrition.
As detailed in our article “Six Steps to Implement Annualised Hours in the Contact Centre“, the contact centre must do the following to implement such a scheme of their own:
- Move staff onto a yearly hours contract (e.g. 1820 hours)
- Identify optimal levels of FTE throughout the year
- Set a minimum and maximum flex period
- Add clauses to an advisor’s contract to specify the amount of notice required to “call in” banked hours and the number of hours that they can bank
- Make advisor promises
- Track the number of hours being worked
7. Maximum Occupancy
Maximum Occupancy is used to measure the proportion of logged-in time agents spend on call-related activities, balancing workload and preventing overuse.
What is the Industry Standard for Maximum Occupancy?
The Call Centre Industry Standard Metric for Maximum Occupancy is 83.3% (based on 190,702 entries into our Erlang Calculator)
While it is generally understood that occupancy in the contact centre is best placed between 85 and 90%, to get the most out of the team and to protect them from burnout, most contact centres are not reaching this level.
According to our Erlang Calculator, the average percentage for occupancy in the contact centre is 83.3%. So, what can contact centres do to find this sweet-spot of 85–90%?
Two Ways to Surpass the Maximum Occupancy Standard
Ensure That Staff Scheduling Systems Account for Occupancy
According to our report, “What Contact Centres Are Doing Right Now – How Do You Compare? (2017 Edition)“, most contact centres still use spreadsheets to create schedules.
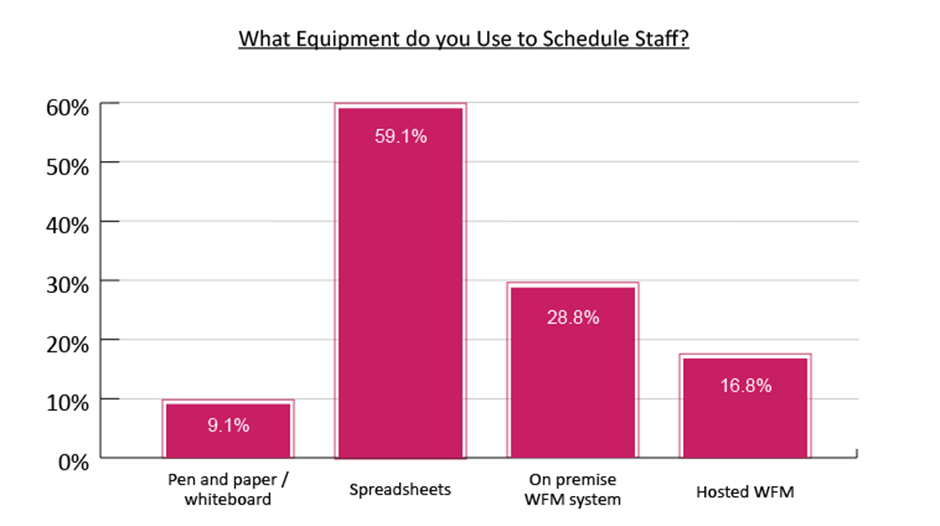
To do this, these contact centres will likely use spreadsheets in tandem with an Erlang Calculator. However, there are many Erlang Calculators that do not account for occupancy, meaning that contact centre staff could be significantly over-utilised.
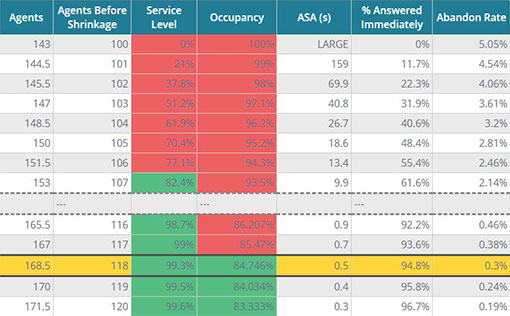
While some Erlang Calculators only account for service level, meaning that there are still enough advisors to answers the forecast number of calls, occupancy ensures that the team are not being overworked, as highlighted below. This can be a significant factor in maintaining morale.
Train Advisors to Handle Calls Across More Than One Channel
Whatever system the contact centre uses, unexpected peaks and troughs in call volumes can be a big problem and can cause occupancy to swing either way.
When occupancy is too high, advisors are overburdened. Yet, when occupancy is too low, the team will have little to do, meaning that the contact centre is essentially wasting money.
This is where blended advisors can help, as having a team that can switch channels to match unexpected rises in call volumes on one particular channel type can help to “deflate the situation”.
Also, when occupancy dips lower than expected, this could be the best opportunity the contact centre has to encourage advisors to use e-learning, handle back-office queries and so forth.
To find out more about maximum occupancy in the contact centre, read our article: How to Calculate Occupancy
Thanks to the following people for their help in putting this article together:
If you are looking for more great articles on call centre metrics, you should read these next:
- Top 10 Customer Experience KPIs
- The Best Metrics for Contact Centre Performance Tracking
- The Top 10 Most Important Call Centre Metrics
Author: Jonty Pearce
Reviewed by: Robyn Coppell
Published On: 11th Apr 2018 - Last modified: 23rd Jan 2026
Read more about - Call Centre Management, Average Handling Time (AHT), Brent Bischoff, Business Systems, CallMiner, David Preece, Editor's Picks, Erlang Calculations, First Contact Resolution (FCR), Frank Sherlock, Management Strategies, Metrics, Net Promoter Score (NPS), Occupancy, QStory, Quality, Service Level, Shrinkage