


We provide a simple step-by-step approach to forecasting demand in the contact centre.
Step 1 – Understand Your Forecast Building Blocks
To predict the future, we first need to understand what has happened in the past.
When we look into past contact volumes, there are three key things that we need to identify that will give us an idea of future demand. These are our three key “building blocks”:
- Seasonality – This is how demand changes by time of day, day of the week, week of the year and month of the year.
- Trend – This denotes the general change in the movement of data – whether it shows increasing or decreasing demand – from one short-term cycle to the next.
- Level – This is the average demand across a short-term cycle.
These building blocks are the basis of almost every forecasting model. However, there are also “noise factors”, which we need to account for.
Noise factors are special events or causes that will potentially damage the accuracy of your forecasts. Examples of noise factors include:
- New Growth – If your brand launches a new product or service, your forecast will be open to volatility and demand will be difficult to estimate.
- Future Product/Service Changes – Is your organization planning to make changes to its proposition? You need to know the plans so you can adjust your forecast accordingly.
- Marketing Promotions – When marketing send out a special promotional offer to customers, you need to know about it well before, so you can account for the extra demand.
- Customer Sensitivity – If your organization is prone to short-notice demand – like a student accommodation provider, as an example – volatility will be much greater than in most other sectors.
- Self-Service System Maturity – Have customers now got used to self-service and are moving away from contacting you? Consider what impact this is having on your forecast.
- Holiday Periods – Certain fluctuations are caused by special holidays, including Christmas, Valentine’s Day, Easter, Thanksgiving. Account for these and other special events like the Olympics or the World Cup.
Now you understand trend, seasonality, level and noise factors, all that you need to do before you start building your forecast is:
- Define Your Time Frame – This is the length of time that you intend to forecast for – whether that’s an intraday, weekly or monthly forecast.
- Define Your Granularity – Do you plan to predict demand at 15-minute, 30-minute or hourly intervals?
Step 2 – Gather Your Data and Clean It
The source and the accessibility of the data that you will use for your forecast will depend on a number of different factors. These include:
- Your technology set-up and the historical reports they generate
- How far back in time your historical reports go back (ideally three years minimum)
- The type of channel that you are looking to create a forecast for – e.g. phone, email, live chat
Knowing this, we must identify what data we need, considering our building blocks above, and what data we have available.
If no data is available, you can use financial reports and professional feedback from planning experts in your sector. More insights on this can be found in our article: How to Forecast With Minimal Data
Yet if we are lucky to have daily contact volumes from the past three years or more, we can move on to the next stages of:
- Cleansing the Outliers – Question: what caused previous peaks and troughs in call volumes? What impact did they have? Are they happening on a routine basis? Make sure that you are not missing key trends or information before you dismiss your outliers.
- Identifying Patterns in the Data – See what impact your noise factors had on your historical volumes and look for new patterns. These patterns may alert you to new noise factors that are more specific to your own business.
Step 3 – Choose Your Forecasting Model
Once you have gathered your historical contact volumes, cleaned the data and identified your noise factors, it is time to choose which forecasting model you will use.
There are many models of forecasting demand out there. Some of the most common in the call centre include:
Triple Exponential Smoothing (Holt Winters)
This model uses trend, level and seasonality on a month-by-month basis. The level is last month’s contact volumes. The trend is the expected change in volumes from last month.
The seasonality is the impact of the seasons on the volume. You then use these to forecast the next month’s demand, which you can chop into smaller chunks and identify potential noise factors.
ARIMA
This model can get very technical, but at a basic level it involves comparing recent demand with past patterns and identifying key similarities and differences.
Understanding these, you predict a future pattern and apply a “moving average”, which is a value that defines how quickly contact volumes are either increasing or decreasing.
Jonty Peace, Editor of Call Centre Helper, discusses in better detail how both of these forecasting models work in the video below:
Home-Grown Algorithms
If you have worked in a contact centre for long enough, you may be able to forecast based on your own set of rules, parameters and steps.
These can all be formulated into an algorithm, which does much of the hard graft for you. You just need to remember to look over the results yourself, using your planning and forecasting wisdom to ensure it is not producing any errors that may skew your results.
Yet many contact centres still use more manual methods of forecasting, which will most likely follow a refined version of the five steps below:
- Create a yearly forecast estimate by analysing call data, in terms of trend and level from one year to the next.
- Split the yearly volume into months, keeping a careful eye on seasonality – i.e. what percentage of your yearly traffic usually falls across each month.
- Assess your week-by-week and day-by-day trends and split your monthly demand accordingly. You will likely find Monday to be your busiest day.
- Assess how your demand normally changes across the day and divide your daily contact volumes into periods of 15–30 minutes.
- Refine your forecast by identifying potential noise factors and factoring those in. To do this, get hold of information like the marketing schedule, new product launches and website/self-service updates.
Just remember, though, that you want to experiment with as many different forecasting models as possible in order to find out which works best for your contact centre. Don’t just wait until something goes wrong to start experimenting.
To find out about the latest most sophisticated forecasting methods, read our article: The Latest Techniques for Call Centre Forecasting
Step 4 – Test Your Forecasting Models
You need to test your forecasting model to see if it provides accurate results, before you start using it in the contact centre.
To test the accuracy of your forecasting model, make a forecast for a certain time in the past and measure forecast accuracy. This will give you an idea of how well it will work in your contact centre environment.
If the results are not accurate, the planner will tweak their forecasting model until they consistently achieve a better forecast accuracy with their new model than with the contact centre’s old model.
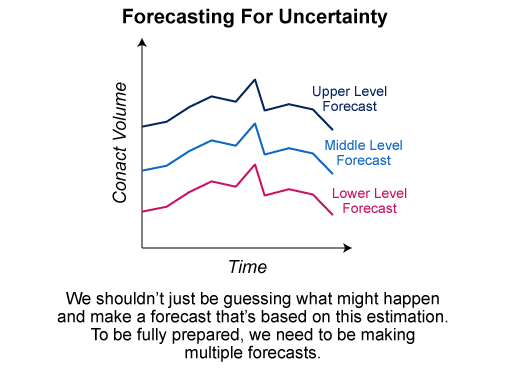
When in this testing phase – as well as when you take your forecasting model into the “real world” – it can also be best practice to create three forecasts (or maybe even more) using the same model.
This is important because all forecasts have a certain amount of uncertainty in them. So if we can create Upper-, Middle- and Lower-level forecasts, we can be prepared for every possible scenario.
Other quick pieces of advice for testing your forecast model include:
- Forecast “what-if” scenarios to test how well your model will cope with increased demand.
- Track the impact of one change at a time, so that you can properly monitor its impact.
- Work your way down to forecasting at 15-minute intervals, once your model starts showing promising results. This allows you to better match the workload to your workforce.
Step 5 – Factor in Special Events
While your forecasting model may have already considered these to some extent, there are a number of special events – some of which may be at very short notice – that can impact your forecast.
This is why it is so important, when you gather and collect your data, to question your outliers and assess the cause and effect of your noise factors.
What you will find is a number of noise factors that you hadn’t previously considered – like weather conditions, student term schedules or the clocks changing.
But when you put your forecasts together – maybe a month in advance – many of the noise factors will have not yet come to light.
It is therefore important to not only understand all of your noise factors, but to identify any sudden causes for them and know their potential impact, so you can address your forecast accordingly.
To keep tabs on these noise factors it is important to ask for updates on the actions of other departments, monitor changes customer behaviour and watch the news.
Step 6 – Review the Success of Your Forecast
Once you’ve starting using your forecasting model to predict demand, it is good to take a step back and ask: what could we do differently in the future?
No forecasting model is 100% accurate all of the time, but you’ve got to learn the lessons when things go wrong or when you get a little lucky, otherwise your forecast accuracy won’t improve.
So learn those lessons and then start to build on your model, trying out a few ideas to improve forecast accuracy, once again going back to a safe environment to start with.
Some advice that may help you to improve your forecasting process includes:
- Track call reasons to find the root cause of customer demand, so you can better understand call trends and patterns.
- Collaborate with colleagues whose actions have the potential to influence contact volumes.
- Find ways to enhance the quality of your data by considering you can improve how you collect, refine and analyse it.
For more advice on improving how you forecast demand and other planning guidance, listen to the following episode of The Contact Centre Podcast, which features workforce management (WFM) expert Doug Casterton.
The Contact Centre Podcast – Episode 22:
Resource Planning Advice To Boost Efficiency And Engagement
For more information on this podcast visit Podcast – Resource Planning Advice to Boost Efficiency and Engagement
Step 7 – Helpful Forecasting Tools and Resources
To close this article, let’s take a quick look at some resources and tools that will help you further in your journey to creating the best possible contact centre forecast.
Of course the most helpful forecasting tool is software from a specialist WFM provider. To find out more about this software, follow the link to find our list of recommended WFM providers.
For those of you who lack the budget for this option, you can also experiment with free online forecasting tools. You can use our tool by following the link: Experimental Online Forecast Calculator
In terms of helpful resources, we also have a number of other articles that provide even more valuable insights into the world of forecasting. These include:
- A Guide to Workforce Forecasting in the Contact Centre
- Workforce Optimization: 17 Ways to Improve Your Contact Centre Forecasts
- What’s Happening With Forecasting Right Now?
Author: Robyn Coppell
Reviewed by: Hannah Swankie
Published On: 19th Oct 2020 - Last modified: 28th Jul 2026
Read more about - Workforce Planning, Forecasting, Workforce Management (WFM), Workforce Planning