


Forecasting is at the heart of effective contact centre planning, and getting it right means happier customers, smoother operations, and better use of resources.
Call centres have no shortage of data, yet accurate forecasting remains a major challenge. Shifting demand, customer behaviour, and internal variables often make it difficult to get right, which can lead to overstaffing, missed SLAs, or stressed agents.
To find out what contact centre leaders can do to improve their forecasting we take a look at the latest thinking on the 4 leading models for generating contact centre and workforce management forecasts.
The Main Four Call Centre Forecasting Models
So lets take a look at each of these four forecasting models to help you find the one that works for you:
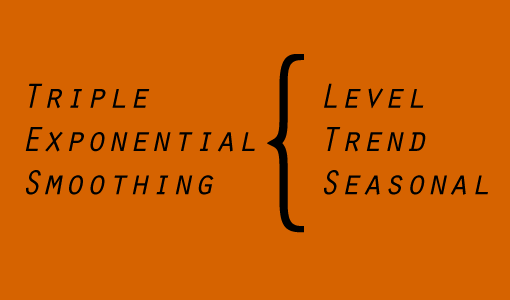
1. Triple Exponential Smoothing
Triple Exponential Smoothing (also known as the Holt Winters technique) is a simple forecasting technique and one that is surprisingly robust as a forecasting method.
It has been in use since the 1960s and is widely used in call centre forecasting – it makes up the backbone of most workforce management (WFM) forecasting systems.
For more information take a look at the Beginners Guide to Workforce Management Software.
The term triple means that the forecast data is split into 3 forecast components – Level, Trend and Seasonality – to “isolate” each component from each other.
If we take the example of a monthly forecast then the three components are
- Level – Last month’s forecast
- Trend – The expected increase or decrease in contacts from last month
- Seasonal – The impact of the seasons on the data (so, for example, March could be 120% of the average month in the year and August could be 85% of the average month – as many people are on holiday in August and are less likely to call the contact centre).
The term exponential smoothing applies to the way that data is smoothed (or averaged) from one period to the next.
With Triple Exponential Smoothing, the Level, Trend and Seasonal Trends are smoothed exponentially. The hard work comes in the choice of smoothing coefficients – Alpha (for Level), Beta (for Trend) and Gamma for Seasonality.
One of the advantages of this method is that once you have got your head around the method, it is easy to model it, and can even be forecast in an Excel spreadsheet.
We have developed a call centre forecasting tool, a free Monthly Spreadsheet Template, that you can use.
The big danger is tit is very easy to “over-fit” the data, so that if there are any anomalies in the historical volumes, such as outages or peaks in demand, these can result in very odd-looking forecasts.
While Triple Exponential Forecasting can be viewed as a robust “general-purpose” forecast model, it is better suited to long-term forecasts than to shorter-term forecasts:
It is also possible to use double exponential smoothing and a range of other variants.
[The paper – Barrow, D. K. (2016). Forecasting intraday call arrivals using the seasonal moving average method. Journal of Business Research, 69(12), 6088-6096. DOI: 10.1016/j.jbusres.2016.06.016]
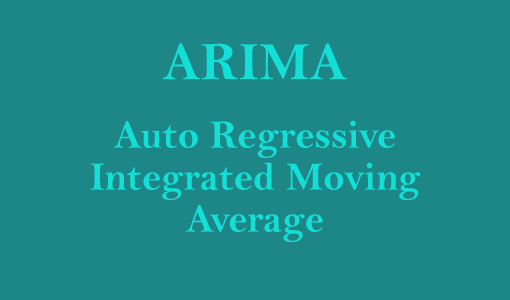
2. ARIMA (Auto Regressive Integrated Moving Average)
One more advanced (and more complex) forecasting method that has been more popular over the past 10 years is ARIMA.
ARIMA is an acronym that stands for AutoRegressive Integrated Moving Average.
Interest in ARIMA grew after the Office for National Statistics adopted it as a preferred algorithm in 2007.
ARIMA has three main components:
- AutoRegression – the ability to compare data with past patterns (e.g. a time lag from 12 months or 52 weeks ago)
- Integrated – the ability to compare or difference the current observation from the previous observation
- Moving Average – the ability to smooth out data over a number of past periods.
It is often said that Triple Exponential Smoothing is a special case of ARIMA.
One special case of ARIMA that looks quite promising is a special formulation of ARIMA called Double Seasonal ARIMA, which was developed by Taylor at Oxford University.
This allows you to enter multiple seasonality into the data. So, for example, you can enter in half-hourly data by setting the seasonality to 48 time periods (i.e. 24 hours) and 336 time periods (48 x 7 time periods or one week).
You can find out more about Double Seasonal ARIMA here
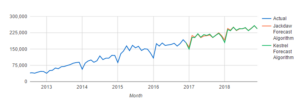
Which Is Better for Contact Centre Forecasting – Triple Exponential Smoothing or ARIMA?
In theory, the ARIMA method should be able to produce better results. Triple Exponential Smoothing has three parameters, so it is a fairly simple method. ARIMA has more parameters and some of them are more intuitive. The problem comes in that the complexity can be its own downfall.
According to Brian O’Donnell posting on Stack Exchange, “I have seen people with different data sets compare results from both algorithms and get different results. In some cases, the Holt-Winters algorithm gives better results than the ARIMA and in others cases it is the other way around. I don’t think you will find and an explicit answer on when to use one over the other.”
“The problem with both ARIMA and Exponential Smoothing is that they are both hopeless on getting a long-term trend on high-frequency data” says Nikos Kourentzes, Associate Professor (Senior Lecturer) at Lancaster University.
The different regression- based forecasting techniques are discussed in this Webinar: How to Design a Better Forecasting Spreadsheet.
3. Neural Networks
Neural networks have been getting a lot of press recently, particularly since Google has started using them for artificial intelligence – in speech recognition and in their search algorithms.
Neural networks can also be used in contact centre forecasting.
“Neural networks have been used in forecasting for over 20 years, but recently we have seen a huge increase in computing power which has made them much more practical,” says Nikos Kourentzes Associate Professor (Senior Lecturer) at Lancaster University.
A neural network is a network that tries to model the neurons or brain cells in the human brain. It is built up of a number of “nodes” that try to simulate the function of the human brain.
The networks look at a series of inputs and then try to adjust a “hidden” network, by changing a number of weightings until they get close to matching the output. For example, they will scan in a series of numbers of calls and try to match the next item of data to the forecast.
It looks like neural networks could have a lot of potential advantages for contact centre forecasting
- They do not need complex algorithms programmed into them as they learn from the data supplied
- They can take in external inputs – such as special days, marketing activity, website page views of the temperature to model different factors.
Some of the most exciting factors for neural networks could be in automatically isolating special days from the forecasts.
But there are a number of downsides of neural networks.
“Neural networks get mixed reviews, in part because they are used incorrectly. The idea is that if I have a forecasting problem, I use a neural network, no matter the specific challenges of the problem, and it will help solve the issues. Somehow I will gain in accuracy,” says Devon Barrow, Associate Professor (Senior Lecturer) at Coventry University.
“Neural networks get bashed because they are so-called black boxes – you can’t see what is going on inside.”
Neural networks are also “very input heavy”, which means that they are best placed to work with high-frequency intervals (typically half-hourly or quarter-hourly) data.
If you do not have multiple years of data available, take a look at our article on How to Forecast With Minimal Data.
The key to generating neural networks seems to be in how many nodes (in essence, how much memory) the network has. In theory more nodes should generate better results but much slower performance.
“If the problem is linear then a single node should be sufficient. The more complex the series then the more nodes you will need,” says Nikos Kourentzes.
“But complex does not mean complex as it appears to the eye. A contact centre time series looks quite complex to me, but not in terms of mathematics. In most contact centre applications a small number of nodes should be enough.
“Neural networks are also not very good at doing trends, but they are very good at dealing with seasonality,” concludes Nikos Kourentzes.
For more information on how neural networks work I would recommend reading Steven Miller’s article on “How to Build a Neural Network”. This takes you through how the logic works along with a simple worked example:
4. Multiple Temporal Aggregation (MTA)
The very latest thinking in call centre forecasting is Multiple Temporal Aggregation. This is a method to combine both high-frequency data (hourly daily, weekly) with longer-term trends over time.
So, for example, if you take the total number of contacts that you got in 2016 and compare that with 2015, and you see that it has increased by 8%, then this is your trend. You have completely removed the seasonality. In essence, this averages out the contacts and special events across the year.
“On annual data, you can see the long-term movements very easily, but you see none of the seasonality or the promotions or the special events. In the high-frequency data [hourly, daily] you see the exact opposite,” says Nikos Kourentzes.
“By aggregating the series, you see it from different viewpoints. You will never be able to extract from a single viewpoint everything, but if you pull together all of the aggregation from different aggregation levels, then you have a holistic view.”
The advantage with Multiple Temporal Aggregation is that you can focus both on the intraday and the longer-term data at the same time.
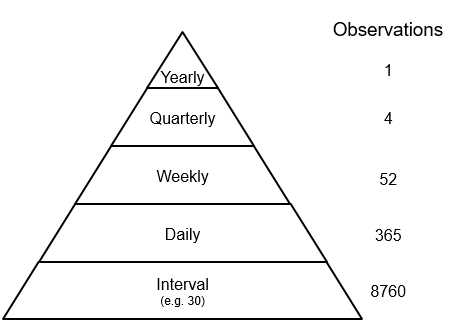
“Let’s say I want to forecast a week ahead. What you do sounds a bit strange at the beginning and then it makes sense. I will need to forecast a year ahead in everything,” says Nikos Kourentzes.
“A year ahead in hours, a year ahead in days, a year ahead in weeks and a year ahead in quarters and a year ahead in years. So one will be one observation, at the other end it will be 8,760 observations.
“The advantage is that now you have created a pyramid where you can reconcile the values and everything adds up properly. You can carry over information from the top level to the bottom level and vice versa.”
To help with the understanding of how Multiple Temporal Aggregation works a software model has been produced in the statistical modelling package R, called MAPA – Multiple Aggregation Prediction Algorithm, which produces some promising forecasts. There is also another MTA algorithm called Thief.
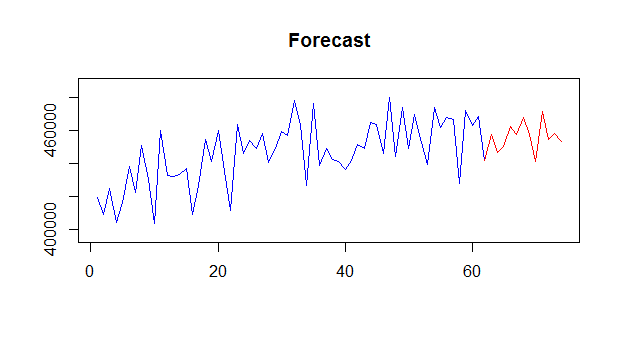
The results of this approach look very interesting.
The detail of how MTA works is a bit outside of this article – but the links here will provide further information:
- Multiple temporal aggregation: the story so far. Part I
- ISF2017 presentation: Call centre forecasting using temporal aggregation
Three Challenges of Call Centre Forecasting Today
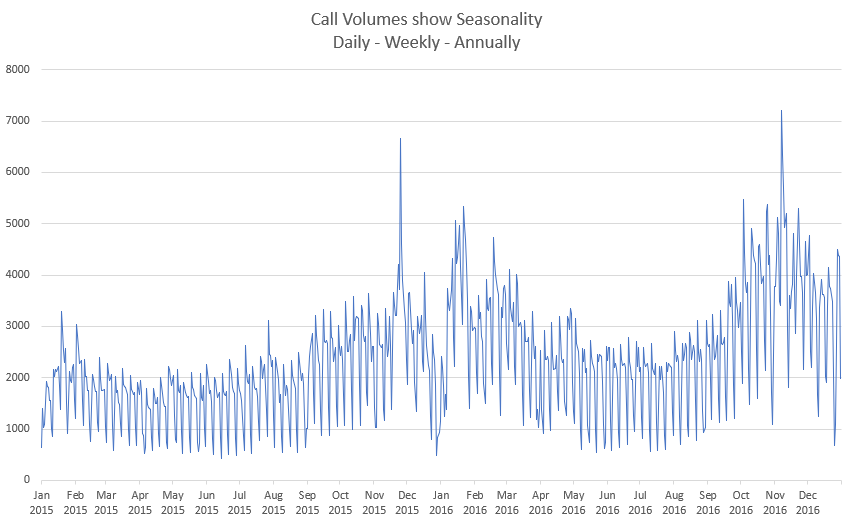
Multiple Seasons
Contact centres have an interesting data format in that they have a huge amount of data which follows a number of seasonal demand patterns.
Call centre data is typically supplied in a range of different patterns
- Interval – typically every hour, half hour or 15 minutes
- Daily
- Weekly
- Annually
Dealing With Higher Frequency (Hourly and Daily) Data
One of the problems with contact centre data is that hourly data is often flattened down into an average daily profile.
“In general, we found in industry that the standard approach is to use some sort of exponential smoothing, most likely Holt Winters,” says Devon Barrow, Associate Professor (Senior Lecturer) at Coventry University.
“Usually that’s done at the weekly level for resourcing and general capacity and then disaggregated. For daily or half-hourly figures an average daily and hourly profile is then applied to the weekly forecast volumes for use in scheduling.
“The standard approach seems to be based on forecasting at a very high level.”
Isolating Special Days From the Forecast
Contact centre data or Front Office Data is often more difficult to predict as it contains a range of contact peaks and troughs that need to be isolated from the forecast.
These can be drawn from a range of special factors, including:
- Spikes in contacts – this can often be a result of a marketing promotion.
- Step changes in demand – for instance acquiring a new company or bringing in new product.
- Weather factors – snow, floods and very hot weather can have big impacts on the number of calls coming in to the contact centre.
- Special Events – Events such as the World Cup can cause a big drop in calls, but do not occur every year.
- Equipment failures – a power cut, phone lines being cut or an equipment failure that fails to record the number of incoming contacts.
According to John Casey from The Forum (previously known as the Professional Planning Forum): “You need to be able to isolate special days from your contact centre forecasts before you put them through your forecasting method. Otherwise the assumption will be that there will be a World Cup every year.
“In essence, you need to take out the special days, run the forecast and then put them back in to your data for reporting purposes.”
Which Forecasting Approach Will Prevail in the Long Term?
For a group of people who spend their time forecasting the future, the question of which forecasting method will prevail seems a bit like asking the “how long is a piece of sting” question.
Certainly, both neural networks and MTA look like they can deliver promising results.
But it may not be an “either–or” situation.
Combinations of neural networks and other methods are possible. For example, we may see a neural network filter in front of a Multiple Temporal Aggregation model, or we may also see neural networks working in combination with Exponential Smoothing.
“I think that the contact centre industry is lagging behind in the adoption of more complex forecasting methods,” says Devon Barrow.
“However, I don’t think the question is accuracy. If you look four or five years into the future, I think that there will be a shift in general from forecast accuracy to decision making.
“The shift will be to better integration of forecasting into the decision-making process, that is, not only selecting forecasts based on accuracy, but on the quality of decisions they support, such as staff scheduling and training of new agents.”
For more on the topic of contact centre forecasting, read our articles:
- A Guide to Call Centre Forecasting
- 25 Ways to Improve Your Contact Centre Forecasting
- Experimental Online Call Centre Forecasting Tool
Author: Jonty Pearce
Reviewed by: Robyn Coppell
Published On: 2nd Oct 2022 - Last modified: 13th Aug 2025
Read more about - Workforce Planning, Editor's Picks, Forecasting, The Forum, Workforce Management (WFM), Workforce Planning