


In today’s contact centre environment, accurate forecasting is key to balancing service levels with staffing costs.
Whether you’re managing a small team or a large-scale operation, getting the forecast right means better schedules, higher efficiency, and improved customer satisfaction.
This guide breaks down the fundamentals of call centre forecasting—from understanding demand patterns to applying advanced techniques—so you can make smarter planning decisions and keep your operations running smoothly.
The Key to Balancing Service Levels and Staffing Costs
The refrain is common: we need to adhere to our targeted service levels… but at the same time, we also need to keep staffing costs down.
Whether in a contact centre or bank branch environment, workforce managers everywhere face the constant challenge of balancing the priorities of service levels and labour costs.
This is especially true in today’s economic environment, where inaccurate forecasts can lead to poor scheduling decisions and can have dramatic impact on bottom-line profitability.
Forecasting spreadsheets, Erlang Calculators, scheduling spreadsheets and workforce management (WFM) software has long been used to match demand in the form of calls, emails, webchats and other advisor work with supply in the form of the advisors themselves.
Regardless of the sophistication of the WFM tool or processes, the foundation of optimising staffing levels lies in the precision of the forecasting engine.
More precise forecasting is a classic win–win scenario, enabling managers to more closely align demand and supply, resulting in optimal cost and profit performance.
Understanding the Laws of Supply and Demand
When demand (inbound calls, outbound calls, emails, webchats, etc.) is greater than supply (the advisors themselves) – the price, in the form of reduced service levels, falling customer satisfaction and poor advisor morale, rises.
When supply is greater than demand, service levels tend to improve, but at the cost of idle and unproductive advisors.
The key to optimising the bottom-line performance of your contact centre is to find a harmonious balance between supply and demand.
Remember, bottom-line performance is directly impacted by the direct costs of hiring and employing your advisors, but it is also influenced by client satisfaction, advisor morale and other factors.
For more on this topic and a basic step-by-step method for forecasting in the contact centre, read our article: How to Forecast Demand in the Contact Centre
Forecast Accuracy
Forecast accuracy can be defined as the difference between the amount of work per time period projected to be presented and the amount of work that is actually presented.
In a real-world environment, this work may be inbound calls, outbound calls, emails, webchats, etc. In the interest of simplicity, we’ll just call these “calls”.
Many vendors advertise their forecast accuracy and many customers use this metric as part of their buying criteria when evaluating commercial workforce management systems. However, forecast accuracy is only one component of precision forecasting, albeit an important one.
For more on measuring this metric, read our article: How to Calculate Forecast Accuracy
What to Watch Out for When Forecasting
As well as calculating forecast accuracy, another factor that contributes to accurate forecasts is how configurable the forecasting engine is to account for changing conditions.
For example, a linear forecast that simply predicts that the same number of calls will be presented today as were presented yesterday, will be unrealistic and oversimplified, so the forecast engine will have to account for this.
Many factors affect the demand presented to the average contact centre.
The number of factors can be virtually unlimited, but includes regular events like:
- Day of week (volumes may be higher on Mondays than they are on Wednesdays)
- Day of month (volumes may be higher on the 1st, 15th or 30th)
- Season (holidays, anyone?)
For many contact centres, however, being able to create forecasts based on regular events by themselves is not enough. A catalogue retailer, for example, would need the flexibility to forecast the increase in calls soon after a catalogue drop.
Another example would be an entertainment ticketing company, which would need the ability to predict the demand that might be generated when tickets go on sale for a leading musical act.
Also, a public safety agency would need a forecast that accounts for an increase in calls as a result of a major convention or sporting event. You get the idea.
Campaign forecasting provides the ability to include those non-recurring or irregular events in the creation of a forecast. When coupled with the ability to account for the effects of regular events, the contact centre now has a very powerful, flexible tool to create very precise forecasts.
Yet regular events are not the only predictable factors that affect forecasts.
Others include:
- Variations in the volumes of the types of calls offered
- Average Handle Times for each call type
- Abandon rates
This is where the forecast accuracy metric becomes meaningful. This is because forecast accuracy provides a level of confidence in how well the actual call volume will match the projections.
Often, inaccurate forecasts are a product of not fully appreciating the impact of these regular or non-recurring events.
Understand What’s Happened in the Past
Before any staff planning can be done, an enterprise first needs to understand what has happened in the past.
A forecasting solution which provides historical data from entire customer contacts (i.e. from CTI as well as the ACD) means that scheduling can take place in a more realistic way.
Workforce planners should also be able to factor in exceptions – such as advertising campaigns, training and public holidays – and view when the best time for a meeting or training session will be, measuring the impact on the rest of the contact centre.
Running regular hypothetical ‘what-if’ scenarios can show a scheduler how alterations to shift patterns would impact performance, as well as assisting in business continuity by seeing what would happen in a flu epidemic, for example.
A great deal of unnecessary advisor work can be removed by identifying the types of call that are being received and determining whether these could be reduced further up the line.
Departments, including marketing and IT (for the website), should be especially considered when doing this, as their activities will actively affect the volume and type of calls received.
Due to these outside influences, workforce management forecasting is increasingly being used as part of contact centre quality checks, which can include quality monitoring, HR management and training. This is as well as the traditional WFM forecasts and schedules, as all of these factors affect each other.
Understanding when and how other departments will be operating means that WFM tools can be used to forecast and schedule accordingly (e.g. about a new TV advert).
Additionally, contact centre managers are advised to brief the team about the correct responses to issues, as well as changing IVR prompts and messages to provide simple answers and managing advisor skill sets for relevant call groups.
Businesses should look for flexibility in forecasting functionality: situations can develop very quickly, so forecasts can become useless, without the ability to alter schedules dynamically to reflect reality.
However, in 2016, we found that almost half of contact centres are still using manual methods for forecasting, as highlighted below:
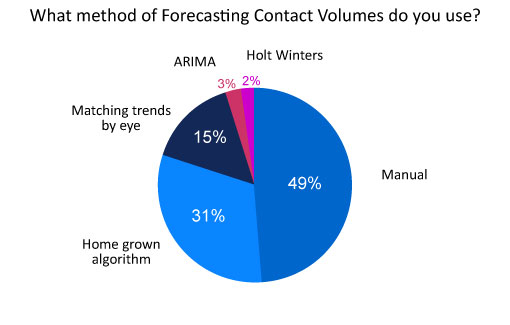
So, below we quickly take you through a process that will allow the contact centre to use spreadsheets for forecasting.
To use our online forecasting tool, follow the link: Online Forecast Generator
Creating Forecasts with Excel
So, the first stage of creating Excel-based forecasts is to analyse historical call data and look out for recurring patterns.
As highlighted earlier, this can be done by pulling data from the contact centre’s CTI or ACD system. Failing that, checking the company’s Call Detail Records (CDR) is the next-best option, and contacting the telephone company would be a final resort.
If done through an ACD system, the contact centre will be able to see the percentage of the day’s incoming calls, broken down to match each reporting period, which is usually up to 30 minutes.
If this is not possible, the contact centre will have to put together its own call-arrival pattern, which might look like the one below.
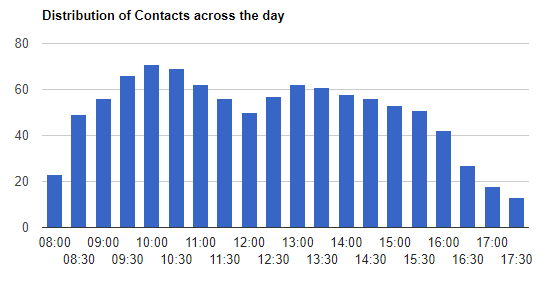
By analysing the call-arrival patterns of a number of days when a similar overall call volume was predicted, the contact centre can break its forecast volumes into 30-minute segments.
Balancing Trend and Seasonality
When making manual forecasts months ahead, the contact centre must pay special attention to seasonality, volatility and year-on-year trends.
Seasonality is important as contact centres will have regular, month-on-month peaks and troughs in contact volumes.
For example, at Christmas time an insurance company is likely to handle a lower number of contacts, as people will have other priorities at this time of year, whereas a mobile phone network will have more business at this time of year, with the expected influx in phone sales.
Trend is also important, as it is unlikely for a contact centre to receive the same number of contacts year-on-year. The trend will likely hinge on the growth of the business and other smaller factors.
So it is important to combine both of these factors by using a technique called exponential smoothing.
Exponential Smoothing
There used to be a time when contact centres would predict call volumes for the year ahead by finding an average from the previous two or three years.
To forecast in the next year’s calls, the contact centre would simply make a basic calculation, using a call centre forecasting formula like the one below.
However, as this method proved inefficient when there was a sharp rise/fall in volumes from one year to the next, contact centres started to use a forecasting technique called “exponential smoothing”.
Exponential smoothing gives the previous year’s call volumes greater influence on the next year’s forecast than the years before. It also takes into account more than just the two or three years previously, but each year that the resource planner chooses to go back has half the “importance” of the one before.
So, we would use 50% as the smoothing coefficient, adding together 50% of the previous year’s traffic, 25% of the traffic from two years ago, 12.5% of the traffic from three years ago, and so on.
This is the exponential smoothing WFM formula in the graphic below.

The more years that the contact centre goes back, the greater the accuracy of the forecast.
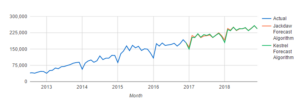
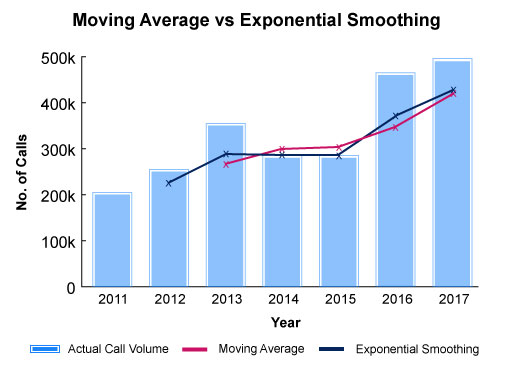
The greater accuracy of the exponential smoothing method compared to the moving average method is highlighted in the graph below. This graph uses the yearly contact volumes noted in the following table.
| Year | No. of Calls |
|---|---|
| 2011 | 200,000 |
| 2012 | 250,000 |
| 2013 | 350,000 |
| 2014 | 280,000 |
| 2015 | 280,000 |
| 2016 | 460,000 |
| 2017 | 490,000 |
Now we know the year-by-year trend, it is time to add in the seasonality and avoid the “naïve forecast”.
Avoiding the Naïve Forecast
Unfortunately, the method of splitting the year’s forecast call volume into 12 equal sets is not an accurate method for creating a month-by-month forecast. This is why it is known as the “naïve forecast”.
Instead, the contact centre should look at the trend across previous years and find the average percentage of yearly calls that are expected each month.
| Month | Percentage of Yearly Calls in 2016 | Percentage of Yearly Calls in 2017 | Predicted Percentage of Yearly Calls in 2018 |
|---|---|---|---|
| January | 6% | 6% | (6+6)/2 = 6% |
| February | 8% | 9% | 8.5% |
| March | 11% | 11% | 11% |
| April | 10% | 11% | 10.5% |
| May | 10% | 10% | 10% |
| June | 9% | 8% | 8.5% |
| July | 6% | 6% | 6% |
| August | 6% | 6% | 6% |
| September | 9% | 9% | 9% |
| October | 11% | 10% | 10.5% |
| November | 10% | 9% | 9.5% |
| December | 4% | 5% | 4.5% |
Then, divide this percentage by 100 and times that figure by the overall contact volume for the year, as found earlier. By doing this, the contact centre has predicted month-by-month forecasts for the year ahead using a technique called “triple exponential smoothing”
Triple Exponential Smoothing
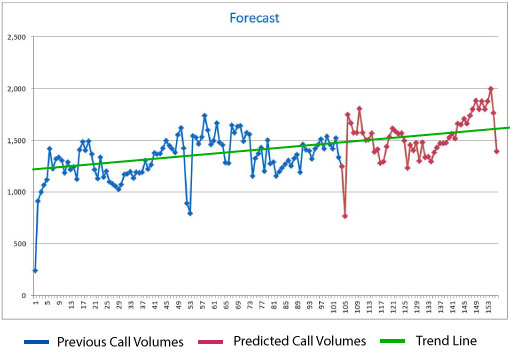
As the forecast has taken into account the yearly change in contact volumes through exponential smoothing (TREND), predicted the next year’s contact volume (LEVEL) and split the level according to monthly percentages of the overall year’s predicted volume (SEASONALITY), each of the three components of “triple exponential smoothing” has been considered.
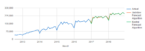
Once the contact centre has produced a forecast through this “triple exponential smoothing”, it can put together a graph like the one below, which may help when scheduling advisors for the year ahead.
Don’t Overfit Data
One final point about balancing trend and seasonality through exponential smoothing is to watch out for “noise” in amongst the contact centre’s historical data.
By this, we mean that there will be anomalies, where a lot more contacts entered the contact centre than would have been expected. This could be because the company’s website went down or because of an incident of a similar nature.
So, when referring back to historical data, look out for any great spikes in call volumes that cannot be accounted for by seasonality. When one of these spikes is identified, it is best practice to remove the data from any future forecasting calculations.
Four Strategies for Forecasting
From the most basic methods of forecasting to the most sophisticated and the most likely to give the most accurate results.
While triple exponential smoothing has been used in contact centres since the 1960s, the other methods highlighted below have really grown in prominence over the past decade and offer the most precise forecasts.
1. Triple Exponential Smoothing
This method can be used through spreadsheets and it involves splitting data into three components: Level, Trend and Seasonality (see above).
2. Auto Regressive Integrated Moving Average (ARIMA)
This strategy also has three main components, as highlighted below:
i. AutoRegression – The ability to compare data with past patterns
ii. Integrated – The ability to compare or difference the current observation from the previous observation
iii. Moving average – The ability to smooth out data over a number of past periods
3. Neural Networks
Neural networks have the ability to inspect a great number of calls and try to match the next item of data to the forecast.
4. Multiple Temporal Aggregation (MTA)
This strategy combines hourly/daily/weekly data with longer-term trends. This allows the contact centre to focus on intraday forecasting/scheduling, while looking further ahead.
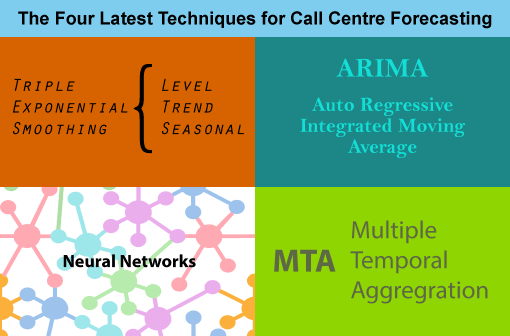
To find out more about each of these techniques, and how to use them, read our article: The Latest Techniques for Call Centre Forecasting
Scheduling the Right Advisors
Now that a precise forecast has been developed, we shift our attention to the supply side of the equation – the advisors.
In an ideal world, there would always be enough appropriately skilled advisors to handle each call as it arrived to satisfy service level, customer satisfaction, cost and revenue objectives. However, as we all know, the contact centre is rarely a perfect world.
To state the obvious, every advisor is different. They have different skills, competencies, proficiencies and schedule preferences. In addition, myriad external factors affect an advisor’s ability to perform well.
To find the correct balance between schedules and forecasts, it is important to match the right advisors to the projected work based on these factors.
Creating the initial schedule is the easy part, and the Erlang Calculator and commercial workforce management forecasting products do it well.
It’s when advisors start calling in sick, or call volumes are different from what was forecast, or advisors leave and return from meals and breaks early or late that the real fun begins.
So, it’s important to remember the best scheduling plan is not set in stone; rather it can be easily adjusted by workforce analysts and supervisors who are close to the action.
Powerful process automation tools can make this job much easier. For example, if an advisor calls in sick or is going to be late for their shift, the tools can note the advisor’s disposition and immediately identify potential replacements based on user-defined factors.
For those advisors calling in sick, these tools can also identify whether or not that advisor had previously requested time off for that day that had been rejected.
Automation tools also have benefits in terms of intraday management, as the real-time shift of advisor schedules in the “heat of battle” is also made much easier through drag-and-drop interfaces.
Extending or shortening an advisor’s schedule is easily accomplished in this manner. Advanced WFM systems will also provide immediate feedback regarding impact to service levels, workload fit (the relative balance between supply and demand) and advisor costs.
For more on this topic, read our article: An Introduction to… Process Automation Technology
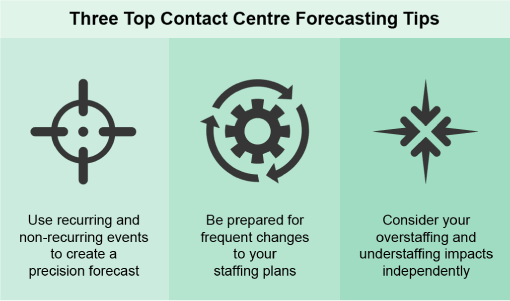
Top Contact Centre Forecasting Tips
Use Recurring and Non-Recurring Events to Create a Precision Forecast.
Forecasting best practices suggest that more accurate forecasts enable more effective scheduling.
Be Prepared for Frequent Changes to Your Staffing Plan.
Advisors call in sick, will be late, will need to leave early, won’t leave or return from meals and breaks on time for a variety of reasons.
Streamline the schedule-change process to reduce administrative overhead (and associated costs!) and ensure key metrics continue to be met.
Consider Your Overstaffing and Understaffing Impacts Independently.
Have a keen understanding of what factors drive the business. If customer satisfaction is your top priority some overstaffing may be desirable, even if it results in increased advisor costs. If revenue generation and profit maximisation are most important, then understaffing may be desirable.
Balancing Forecasting-Related Metrics
In most high-performing contact centres, the two key business-related metrics most closely watched by management are targeted service levels and operating budget (commonly up to 90% in labour costs).
Given differences in business priorities and resources, each organisation needs to analyse its unique situation to determine the right balance between the competing needs of these two metrics.
When demand outpaces supply (understaffed condition), callers wait longer for their calls to be answered, lowering service levels. This has the potential to reduce customer satisfaction and negatively impact customer retention.
In virtually every contact centre environment, customers represent the revenue side of the profit equation. At the risk of stating the obvious, lost customers means lost revenues. This is in addition to lowering advisor morale and, consequently, boosting advisor attrition.
When supply outpaces demand (overstaffed condition), advisors are idle and non-productive. Service levels may be high, customers may be delighted, but money is essentially wasted due to these idle advisors.
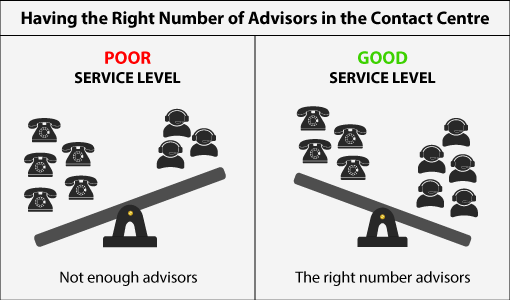
Advisor salaries represent the lion’s share of the variable cost component in a contact centre. Optimising these costs has a direct and positive impact on profits. This is especially true in today’s tightening economy. Like a see-saw, the operation of the average contact centre fluctuates between these two conditions.
With precision forecasting and flexible scheduling, these fluctuations can be minimised (but not entirely eliminated), creating a harmonious balance between supply and demand.
For more on the topic of contact centre forecasting, read our articles:
- The Latest Techniques for Call Centre Forecasting
- Forecasting Contact Volumes Based on Sales Predictions
- 25 Ways to Improve Your Contact Centre Forecasting
Author: Jonty Pearce
Reviewed by: Megan Jones
Published On: 25th Apr 2018 - Last modified: 13th Aug 2025
Read more about - Workforce Planning, ContactBabel, Forecasting, Full Time Equivalent (FTE), Staffing, Workforce Management (WFM), Workforce Planning