


In his blog “How to Forecast Workload“, Charles Watson of injixo covered the different methods of how to forecasting contact centre workload.
Yet that is only the first step in creating contact centre forecasts. So, Charles Watson is back to explain how you can complete the process.
As well as workload forecasting, it’s equally important to invest time in forecasting the workforce required to staff against the demand you’ve identified in the first step. Ultimately, the objective is not to determine the mere requirement, but to uncover the gap of actual vs. requirement in staffing.
The work you do in forecasting the workforce will then drive a more accurate picture of existing staffing gaps and help you to cover each of them to increase efficiency in workforce management.
Let’s start with the top three mistakes many planners make when forecasting the workforce in their contact centre.
Top Three Mistakes to Avoid in Workforce Forecasting
1. No Reconciling Headcount
Headcount reconciliation should be done at least monthly, if not more often. Understanding exactly how many people you have gives you a baseline to work with.
For scheduling, you should really reconcile weekly, but as we focus on forecasting, monthly headcount reconciliation will give you what you need to identify the gaps for your hiring training plans.
2. Not Properly Accounting for Attrition
Attrition is really challenging to forecast in small organisation. If you have 50 people in a staff group, and project 1% attrition per month, that’s a half person.
Do you reduce by one person or zero? Neither is technically correct, and each may impact whether you’re overstaffed or understaffed.
And don’t forget, you have both voluntary and involuntary attrition.
Do you have insights into how many agents will be terminated due to the attendance policy or through performance management?
3. Not Having Staff Groups Set Up Correctly
In contact centres, you have groups of calls and you have groups of agents. Usually, you have a group of calls that go to a primary group of agents, but then you have some overflow, or cross-utilisation that takes place.
Ideally, you will have higher-skilled teammates that can help deal with simple call types, for example. When you have complicated overflow and cross-utilisation set-ups, it’s easy to lose sight of what a staff group actually is.
Is it a group of agents or is it the aggregate of a particular set of calls? Remember, when you forecast demand, you forecast for calls.
Key Elements of a Successful Workforce Forecast
As you can guess from the tips above, reconciling headcount is the first step in the process. You have to know exactly how many headcount and FTE (full-time equivalents) you have.
To keep things simple, any time I use FTE, I’ll assume a 40-hour work week. But it varies based on location and company. Use your company’s HR system to get the headcount.
That should always be the starting point. Some workforce management teams only track agents taking inbound calls. Others will track coaches, team leaders, etc…
If you track the job types in the HR system that you align to, it makes it a lot easier to use that to reconcile with your agents in the workforce management system. Be sure to reconcile headcount at least monthly, if not weekly. This is the foundation for your staffing forecast.
Accounting for Full-Time vs. Part-Time in Your Staff Requirement
In many markets, everyone works full time. If this is the case, then tracking the number of part-time vs. full time employees isn’t necessary.
Where you do have people working less than 40 hours, this needs to be considered. Your demand forecast (from the first blog) provides FTE requirements, so your supply of agents has to have the same methodology.
There are a couple ways to factor in part-time workers:
1. Have All Part-Time Workers as 0.5 FTE
This is the simplest method and requires only that you know they are part time.
This works best if you have a small percentage of part-timers or don’t have the bandwidth to keep track of a lot of part-time workers.
It’s less accurate, but gives you a directionally correct number so you don’t overstate your workforce.
2. Have Part-Time Workers in the Plan Based on Their Actual Scheduled Hours
This is the more accurate method and, unless you have a lot of changes, he work is in the initial set-up when you add an employee.
This is pretty straightforward to calculate. Just take the number of hours they work and divide it by the number of hours that make up an FTE in that market.
If a person works 24 hours and your FTE is 40 hours, then the maths is 24 divided by 40, which is 60%. So this person would be in your staffing model as 0.6 of an FTE.
Consider Voluntary Attrition in Planning
Voluntary attrition occurs when an agent leaves the company voluntarily. Often, you’ll see a capacity plan with just “attrition” in it.
In those cases, you’re blending together two very different drivers to attrition – voluntary and involuntary. Planning for these independently allows you to adjust your assumptions based on the different factors.
When you plan voluntary attrition, you’ll look at historical data to see what the trends are telling you. Much like with forecasting volume, you can look at how the rate has changed year over year and apply any seasonality.
You may notice that attrition goes up after people get end-of-year or quarterly bonuses. You may also notice a change in voluntary attrition based on the tenure of the population.
New hires (less than a year) generally have a higher attrition rate than employees who have been with the company longer. So you’ll want to determine the attrition rate for new hires as well as tenured employees.
A good way to build the model is to look back at the last several years (I like 36 months, based on experience, but it varies by industry and how stable your business is).
Track the attrition rate for employees less than a year and then do the same for 1+ years. Use this to form your model for each population.
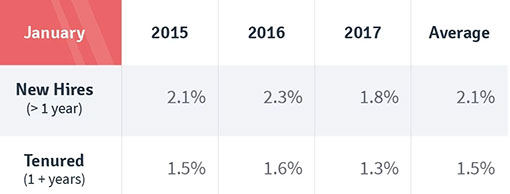
The simplest way to do this is to average each of the 3 years by month (e.g. average of Jan 2015, 2016, 2017 becomes the January model).
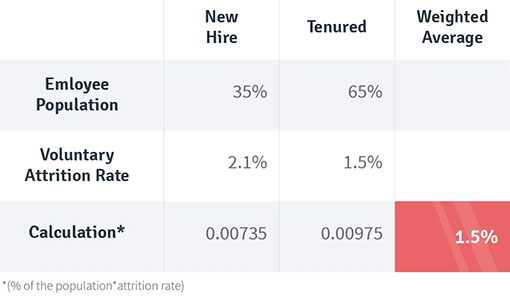
When you’ve done this for each month, you now have a full year model. Then, to get to the total voluntary attrition, you have to weight those based on the population.
Example: Attrition Rates for January
Step 1: Establish a Model for Attrition for Each Month
Step 2: Determine the Weighted Average for the Population for January
Repeat this process for each month. It’s a simple process, because you can just build this in Excel with the formulas and just copy/paste.
Involuntary Attrition Is Completely Different From Voluntary Attrition
Involuntary attrition takes place when employees are terminated by the company, usually for violating policy or as a result of the performance management processes.
While this ultimately impacts the same number (how your current staff attrition affects your future staffing), the driver is different, so you need to forecast for it separately. This is a tougher one to forecast, to be honest.
Looking at the historical data gives you a baseline. But what that data represents is a result of both your policies and the enforcement of your policies.
Let’s say your company has had an absenteeism policy where if an agent calls out unplanned 3 times in a month, they are terminated.
Then the policy is changed so that 2 unplanned absences results in termination. Your historical data is based on one policy, but going forward there is a new policy that is more aggressive.
In theory, that would signal you to increase your involuntary attrition going forward. But as I mentioned, the other layer is how it’s actually enforced.
This is where you really need to understand why the policy is in place (or in this case, why it was changed), and how the operation plans to enforce it. In this example, if the objective is to send a message but not actually terminate more people, your forward-looking assumption probably shouldn’t change.
And if the company does intend to enforce it, then you’ll need to look at the number of employees who call out unplanned twice a month vs. three times a month. If the number is the same, then essentially the policy won’t terminate more people and your assumption will need to stay the same.
So, as you can see, the work to determine involuntary attrition can be complicated, and requires a lot of engagement with your partners in operations. It also requires interpretation. But the pay-off is huge in terms of getting to the right number of staff.
Lastly, Let’s Talk About Staff Moves
This is an area that’s often problematic as well.
When an employee moves from one staff group to another, do you have a systematic way to track and report the change in your workforce management system?
Better yet, does your operations team let you know when a change has been made?
You need to make sure you have a clear process for having these communicated to your workforce management team. Make sure you include situations where they don’t move team leaders but take a different call type. Your intraday performance reports have to account for the correct call type.
You’re looking for any adds (new hires), moves (moving from one call type/group to another) and deletes (terminations). For new hires and for terminations, ideally you get connected into your HR system, because that’s the system of record.
This same process can be used to report any change in status. For example, if someone moves from part time to full time.
In Summary
Forecasting your staff is key to a well-built staff plan and often doesn’t get the focus it deserves. Take the time to really build this out.
You should have regular meetings on this topic, and if it doesn’t take up a significant amount of your (or your team’s) time, then you’re probably not spending enough time on it.
It’s also important to note that the forecasting error for this can be large, because you rely so heavily on insights and observations in addition to the historical data.
Measure your historical accuracy and keep that in mind as you’re making decisions. If your forecast accuracy for the workforce is +/- 1%, you can make strong business decisions based on it.
If the accuracy is +/- 20%, then it’s just guidance, and you have to assume a high probability that you’ll have a different number of staff than planned. You’ll need flexibility options (overtime, voluntary time off, schedule changes, etc.).
Author: injixo
Published On: 20th Jul 2018 - Last modified: 26th Feb 2025
Read more about - Expert Insights, Attrition, Forecasting, Peopleware, Workforce Management (WFM)