


Ric Kosiba highlights key problems with the traditional methods of measuring First Call Resolution (FCR) before sharing some better practices.
An Age-Old Question
Call Centre Helper sent me a note a few weeks ago, asking if I had some interesting data looking at the relationship between FCR and handle times.
Interestingly, I had finished a presentation with some cool graphs that they thought you all would find interesting.
But before we discuss the graphs, I thought I would wade into the discussion on how best to measure first contact resolution (FCR) and offer a contrarian view from those I found here on Call Centre Helper (fun!).
There are two basic approaches:
- Asking customers or agents whether the issue has been resolved
- Counting repeat calls.
Most articles here tend to favour the first, which seems to me to be the most straightforward.
If the customer says their issue has been resolved, well then all is good, right?
But there are issues with this approach:
- Sample sizes are small. Nowadays we all get bombarded with survey requests any time we interact with any company. How often do you respond and take a survey? Small samples make poor metrics with high variability, and survey responses are typically very low.
- Self-selection bias is a problem. Who responds to these surveys? Folks with extra time and customers with a beef. These responses likely do not represent the cross-section of your overall customer base.
- Customers do not tell the truth. I lie on these surveys, based on whether I like the agent. How about you? When I do take a survey (which I do more often than I would like because of professional interest), I tend to put the best spin on my interaction if I simply feel the agent was trying. I’m not honest and I suspect many responses are similarly biased.
- The timing of the survey matters. The survey may arrive before the problem reasserts itself. If the survey comes too far after the event, I won’t even remember the interaction.
So how about the second method, measuring repeat calling?
The major issue in the literature is that when customers call back for different reasons than the first, the measure becomes corrupted. The issue was resolved and now customers are on to another issue.
The worry is that these unrelated call-backs may skew results. This is certainly true of many companies.
For example, organizations with complex sales would never measure FCR using call-backs as a measure.
Companies who specialize in business to business calls with high repeat traffic would likewise not use call-backs as the measure.
Organizations that feature complex processes, like mortgage processing, generate legitimate and desire repeat contacts.
But for businesses that have “one and done” sorts of interactions, like your typical customer service contact centre, this method makes complete sense.
Here are my thoughts on it:
- Nobody calls a contact centre for fun. Anybody calling a contact centre back is truly befuddled, especially if there is a frustrating voice response system at the beginning of any call.
- The big one: The call-back version of FCR is easy to automate. Every contact can be tallied. This means we get a lot of data and near 100% metric coverage, unlike 1-5% with surveys.
- Customers who call back for different reason than the first call are likely statistical noise. Every contact centre agent will receive their similar fair share of new-case call-backs in their metrics. With 100% coverage and transactional contacts, unrelated additional call-backs should be statistical nothings and just part of the call-back baseline for every agent.
- Customers who call back for different reasons than the previous call may not be an aberration at all (Ha! Catch my backtrack?). Those repeat contacts represent a lost opportunity on the first call. Meaning, an agent who offers superior service may be able to surface the second issue and complete the second issue on the first call, too. I’ll show data that hints at this in a bit.
For more on the difference between FCR and repeat calls, read our article: The Difference Between Measuring Repeat Contacts and First Contact Resolution
Thinking About FCR for the Agent
Right before COVID lockdowns in the States, every Monday I travelled from my home in Maryland to Indiana. During this time, I stayed with my parents, who are retired in Indiana.
While I was there, my mom somehow gave her Amazon, cable, Apple, and other passwords to someone, who started alarm bells ringing at all these online accounts when “she” logged in from Pakistan.
Her accounts were all locked. That evening, I called all of these companies to change her password. And they all went quickly, excepting her cable provider.
There, I spoke to seven different agents and had three different chats over four hours or so, simply trying to change her password.
That got me thinking. Did that company provide first contact resolution? Nope, not even close.
But was there a single agent of the ten who was successful? Yes. The last agent knew the secret to changing my mum’s password, and the others did not.
Did the company know that they have a hard time with changing a locked account’s passwords? Probably not.
FCR, really, is an organizational metric, a “how is my contact centre performing?” metric. But there should be an agent metric that measures the agent’s personal contact resolution, which we call active contact resolution (ACR).
ACR is simple. Every time a call enters the system, we check to see whether that customer has previously called within the stated time horizon (say one day to seven).
If they have, all previous contacts are toggled to “No” for ACR, meaning they were not successful, and that the customer’s issue was previously left unresolved.
The current contact is listed as “Yes”, meaning it is positive, unless the caller calls again within the preferred time window.
We tally, from the history of every agent and all of their contacts, their personal ACR score, the percentage of times they handled the customer’s problem correctly.
We feel so strongly about this measure that we automatically tabulate it in our contact centre platform for every call.
A rolled-up ACR represents something stronger than surveyed FCR: it represents how often your agents, as a group, handle the customer’s problem, whether they call once, twice or ten times during the time horizon. This works beautifully, subject to the caveats about the business types we have already discussed (we know that different types of businesses may require different metrics).
Let’s Look at Some Cool Graphs
I was chatting with Aaron Feinberg at Bankers Centricity. He is one of those executives who is both analytically sharp and has also lived contact centre problems for many years.
He posed one of the age-old questions: is AHT in conflict with FCR? He suggested plotting the two.
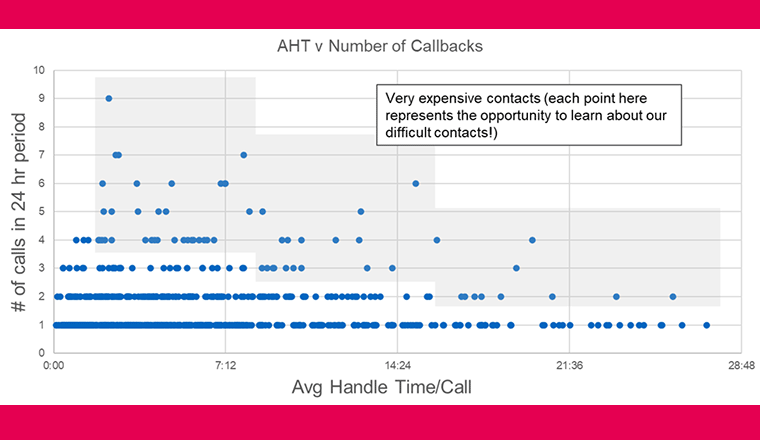
Figure 1 below represents something similar to Aaron’s idea. On the X-axis we plot handle time or average handle time for repeat contacts.
On the Y-axis we plot the number of repeat contacts within a 24-hour window. This is a neat visual. I’ve greyed areas of the graph that represent expensive calls, either many repeat calls or long handle times.
This sort of graph is enlightening. Certainly, we would like to listen to many of these – the points with middling handle times but many repeat calls represent something that should be very interesting to management.
Either the customer is needy, the agent is undertrained, or something is very wrong in our business processes. We can only really know by listening to the string of calls.
There certainly is a nice shape to this that implies that longer handle times typically do not lead to as many repeat calls.
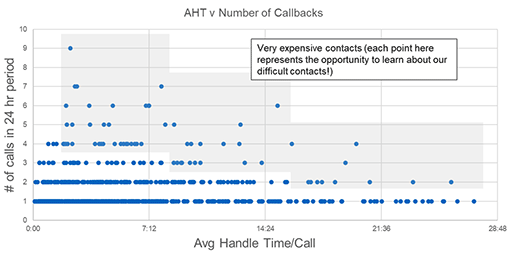
The next graph is even cooler for me, and I’m proud my daughter, an engineering intern, thought it up.
She plotted a similar graph to Figure 1 (Figure 2) and highlighted those agents with the “worst” handle times.
Would these agents also generate repeat calls?
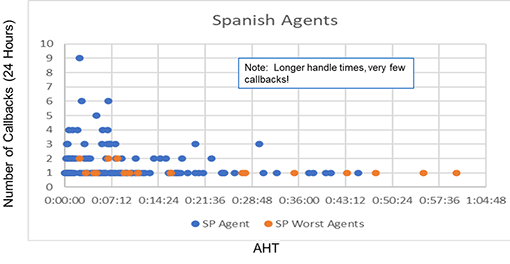
The answer to the question is intuitive and what our experience shows: agents who spend more time with customers generate fewer repeat calls. Conscientious agents solve customer problems and may take more time to do so.
I don’t think this graph answers that old question completely, but it conforms with many a consultant’s intuition.
I suspect, like in many things, the answer is somewhat in the middle: it would be nice to have low(er) handle times and great ACR.
We could find examples of agents who perform this way – they are our real superstars.
One last thought on ACR. ACR measures not just how well an agent handles the current question but also how well they manage the customer.
Do they anticipate other questions? Do they probe a bit? Let’s be really honest, customers don’t want to talk to us, it’s really not a treat.

If an agent can spend a little time to make sure customers are completely taken care of, it is a win–win. Neither we nor the customer want to talk again.
One more last thought on ACR. Our experience (we’ve a free performance management tool built into our contact centre platform and we have a ton of data) shows that ACR correlates directly with customer satisfaction scores.
When ACR improves, so does customer satisfaction. Neat!
Written by: Ric Kosiba, a Chief Data Scientist at Sharpen Technologies
For more on FCR, check out the following articles:
- What Is First Contact Resolution? – With a Definition, Formula and Expert Best Practices
- 20 Tried and Tested Tips to Improve First Call Resolution (FCR)
- The Benefits, Challenges and Best Practices of First Call Resolution
Author: Guest Author
Reviewed by: Robyn Coppell
Published On: 22nd Feb 2021 - Last modified: 12th Jan 2026
Read more about - Call Centre Management, First Contact Resolution (FCR), Management Strategies, Metrics