


Jonty outlines a scientific approach for improving your call-abandon rates.
While no one enjoys queuing for a call centre agent, there are a number of factors which can affect the amount of time your customers are prepared to wait.
There is a distinct difference between sales and technological support
The amount of time customers are prepared to wait depends largely on the service they are trying to get through to. For example, the call-abandon times for a sales line are distinctly worse than those for a technological support line.
This is evident in the graphs below.
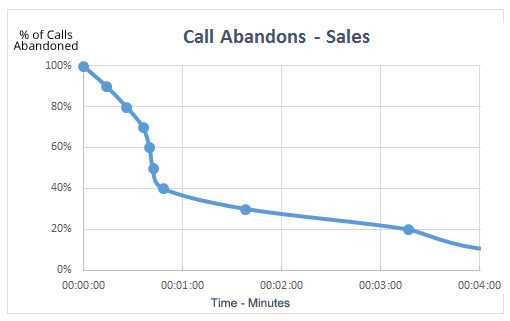
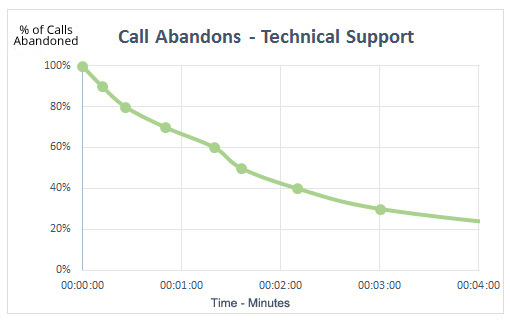
As you can see, after 1 minute only 38% of people are still waiting on the sales line, whilst 65% of people are left on the technological support line.
While the Call Abandon Curve for the technological support line is noticeably better than that of the sales line, both curves could stand to be improved with a few simple changes.
Plotting a Call Abandon Curve
Most telephone systems generate a Call Detail Record (CDR) for each individual call. These CDRs capture information about which line a call came in on, the time it came through, how long the customer was on hold for, and which agent they eventually spoke to (or whether they hung up before being connected).
To plot your Call Abandon Curve, you should:
- Gather around two days’ worth of Call Detail Records
- Extract the call-waiting times of the customers who hung up before being connected to an agent
- Insert the data into an Excel spreadsheet
- Put the data in numerical order – starting with the shortest call-waiting times
- Calculate the percentage of customers by call-waiting time. You should start with 00.00 = 100% and then stagger the rest of your results in intervals of seconds or minutes (depending on the level of detail you want). Your results should begin to look something like this: 100% 0:00, 90% 0:12, 80% 00:19 etc…
- You should then plot your graph, with the X-axis as time and the Y-axis as percentage left in queue.
Once you have plotted your Call Abandon Curve, you will be able to identify the point where you lose the majority of your callers, and can begin to do something about it.
Increase your capacity
The simplest way to improve your call-abandon rates is by reducing or eliminating the number of customers that have to wait in the first place. The most obvious way to do this is to increase the number of staff that you employ.
However, if this isn’t a realistic option for your contact centre, you could also consider making changes to your scheduling or reducing your Average Handling Time.
Taking your busiest periods into account, and adjusting your rotas accordingly, should help you to reduce the amount of time your customers spend on hold.
Similarly, you could try and reduce your Average Handling Time to increase the number of calls your contact centre can take each day.
Change your welcome message to stop people from hanging up
Once you have plotted your Call Abandon Curves, you may find that the majority of your callers abandon the call at around 20 seconds – the moment your first automated message ends. This is unlikely to be a coincidence.
A lot of contact centres play messages such as “your call is important to us” and “your call is currently being held in a queue due to unusually high call volumes”. Although common practice, these messages do little to encourage your customers to stay on the line.
This is because these messages are unimaginative, irritating and – worst – untruthful; if you were really experiencing unusually high call volumes would you have had the foresight to indicate this on your automated messaging system?
If this sounds like your contact centre, you should try replacing these generic messages with a short welcome message which informs your customers that they are being held in a queue. You could also include a compliance message such as “all calls are being monitored for compliance purposes”.
While this may sound ridiculously simple, if you can avoid irritating your customers and simultaneously give them additional information to listen to, you will keep them on the line for longer, increasing the chance that they will get through to one of your agents.
You can experiment with queue messages and examine the Call Abandon Curves to see what impact they make.
Increase the initial ring time
Following a similar train of thought, you could also consider increasing your ring time, rather than clicking straight through to an automated message. This sounds counterintuitive, but can be very effective.
The average mobile phone rings for approximately 18 seconds before clicking through to a voicemail service. Taking this into account, you could experiment with letting the phone ring for between 15 and 20 seconds before playing your first automated message.
This will buy you vital extra seconds at a low risk, as it is unlikely that your customers will drop the call in this time. This is because listening to the repetitive “ring-ring” sound is a familiar experience for most people and shouldn’t irritate them.
Alter the frequency of your subsequent queue messages
Another thing worth taking into consideration is how frequently you replay your in-queue messages, as you may be irritating your customers by playing them too often.
It is worth bearing in mind that a lot of people get on with other things while they are on hold (for example, putting the phone on loudspeaker and browsing the internet), and would much prefer to hear music until they get through to an agent. Especially as every repetition of the message will draw them away from their activity, hopeful that their call has finally been answered, only to find out that they are still on hold.
It isn’t difficult to see how multiple experiences of this, especially in rapid succession, will irritate your customer and increase the chance of the call being abandoned.
If your technology allows it, it is worth experimenting with the length of your message intervals. You could initially adjust the settings so that the first repetition comes in 1 minute after your welcome message, and then add an additional minute onto the interval time for each subsequent repetition. For example, after 1 minute, after 2 minutes, after 4 minutes and so on.
For example:
- First automated message
- 1 minute of on-hold music
- Second automated message
- 2 minutes of on-hold music
- Third automated message
- 4 minutes of on-hold music
- Fourth automated message
Through a series of gradual changes, between which you continue to plot your Call Abandon Curves, you should eventually determine the optimum length of your message intervals.
Try altering your on-hold music
Research has shown that 71% of customers like to listen to music while they are on hold. Yet your choice of music could be causing your customers to hang up the phone a lot sooner than you want them to.
Your Call Abandon Curve should help you to identify if your on-hold music is causing a problem, especially if your steepest drop-off point occurs immediately after the music kicks in.
However, a quick trawl through social media sites (such a Twitter) should also help you to establish what your customers think of your on-hold music.
Here are two examples of what you may find:
Ben Nimmo @benjaminJnimmo
ABBA, Bon Jovi, Queen, Blink 182, Michael Jackson, and a lot more ABBA. Just a taste of the Ikea hold music #onhold
Trevor Joyeux @islandertj
The groovy jazz music that these people are playing is putting me to sleep. #onhold
If you find tweets similar to the latter, especially in great numbers, something is clearly wrong with your on-hold music. Yet finding neither can also be a cause for concern, as this is an indication that your customers are indifferent to their experience. Both scenarios are likely to be having a negative impact on your call-abandon times.
If you find that your on-hold music is in need of a re-vamp, check out the following articles to make sure you get it right second time around:
Allow your customers to opt for a call-back from your agents
Giving your customers the option to request a call-back can also reduce your call abandon times. This is because call-backs enable your customer to be removed from the immediate call-waiting list, and therefore from your statistics, without the risk of you losing their custom.
You may also find that providing this option improves the public perception of your business, as your customers are spared the frustration of waiting on hold.
This is a popular choice for a lot of businesses, including British Gas, who currently offer this convenient service to their customers.
How does a call-back queue work?
- The customer rings through to your helpline and hears your welcome message.
- After one minute, an automated messaging system gives them the choice of either staying in the queue or receiving a call-back.
- If they choose to receive a call-back, the system asks the customer to confirm which phone number they would like to receive it on.
- The customer confirms their choice of number and hangs up the phone.
- The system then keeps your customer’s place in the queue, moving them through the list at the same rate as if they were on hold.
- The customer’s call-back request arrives at the front of the queue and an agent rings them back.
A number of different companies offer this call-back solution, of which Netcall’s QueueBuster is perhaps the best known example.
Leaving a voicemail message could be a more affordable alternative
If you haven’t got the budget to invest in a call-back solution, you could try asking your customers to leave a voicemail message.
To successfully implement this system, you must make sure that you have the time and resources to ring everyone back within a reasonable time frame.
Call-back isn’t for everyone
While a call-back system can help to reduce your call-waiting times, it is more likely to be effective if your inbound calls come in peaks and troughs; creating quieter periods in which to ring your customers back.
If you are constantly busy, you may never see the benefits of this system and you should probably focus more on your AHT or scheduling to reduce your call abandon times.
The benefits of plotting a Call Abandon Curve
By plotting Call Abandon Curves you can begin to identify the weak points in your call-waiting process, and make targeted efforts to improve the customer experience. Not only this, but it is incredibly easy to do, as you already have access to all of the information you need (your CDRs) to plot and re-plot the graphs as you begin to make changes.
While the proposed alterations are undeniably small, it is important not to underestimate the impact they could have on your business, as every second you gain could be the difference between your customer getting through to an agent and you losing contact with them altogether.
For more insights into call abandon rates, read our articles:
- How to Measure Call Abandon Rate
- How to Predict Call Abandon Rates Based on Service Level
- 50 MORE Expert Tips to Improve Contact Centre WFM
Author: Robyn Coppell
Reviewed by: Megan Jones
Published On: 26th Feb 2014 - Last modified: 12th Aug 2025
Read more about - Technology, Abandoned Calls, Average Handling Time (AHT), Call Handling, Hold-Music