


Ric Kosiba introduces a method for predicting call abandon rates and presents the benefits of doing so.
Predicting call abandonment rates is a difficult task, as it is a function of human behaviour and is heavily influenced by factors that the contact centre cannot control.
These factors include: the time of day, the customer’s desire and the likelihood of the customer giving up and choosing another mode of communication (e.g. visiting the company website instead).
However, it is not impossible and can be useful to do, in terms of highlighting future loss of revenue and providing a good indication of customer satisfaction.
A prediction can be made by assessing the relationships of abandon rates with queue times and service level, as we have done below.
STEP 1 – Assess Previous Abandon Rates When the Contact Centre was Operating at Various Service Levels
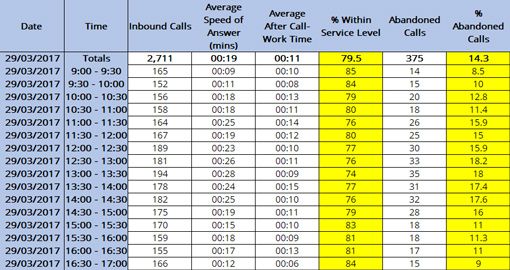
The first step to predicting call abandon rates would be to identify periods where the contact centre was operating at its best and worst service levels, noting the abandon rates at each.
Then, make a note of the service level and abandon rate during each thirty-minute reporting period over the past couple of weeks.
This information can be taken from a call abandons report. A mock-up version of this is presented below:
STEP 2 – Create a Scatter Graph From This Information
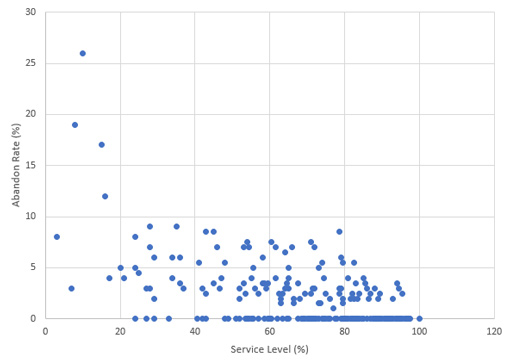
Once this information has been gathered, specific to one contact centre, a scatter graph should be created, plotting abandon rates and service level against one another.
Having done so, it is likely that the scatter graph will look something like the mock-up version we have created, which is shown below:
STEP 3 – Find Correlation and Fit a Curve to the Graph
In plotting the scatter graph above, it is likely that some sort of correlation will be found. When this pattern is realised, all that is left to do is fit a curve to represent the relationship between the two metrics.
For the scatter graph above, we found the following line of best fit:
This correlates well with research from Ric Kosiba, who used Genesys Decisions to look for patterns between varying metrics, using the data that the technology gathered.
Ric’s research confirmed that the relationship between service level and abandon rates for one contact centre followed the pattern shown below:
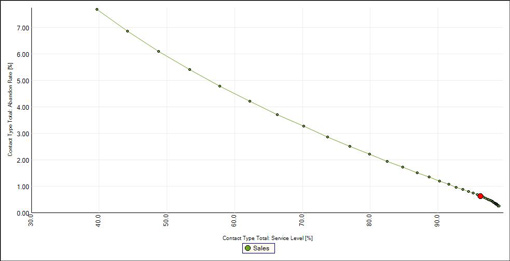
Using this curve, a contact centre can predict their call abandons when they are operating at a certain service level.
For example, if the graph above represented the old data from my contact centre, and it was operating at a 70% service level (10% below the industry standard), I could predict that I was losing over 3% of callers who are phoning in.
What to Watch Out for?
Unfortunately, the method noted above is not faultless, as there three factors that could skew the results. These factors are:
Different Correlation for Varying Call Types
While it is important for a contact centre to create its own graph, based on its own service level and call abandon results, graphs must also be created for different call types.
This is because the abandon rate is going to be higher for service calls than it would be for technical support or reservations, for example.
To highlight this, data drawn from Genesys Decisions provided the following graph based on the activities of one contact centre.
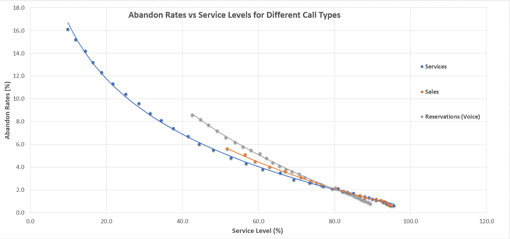
As can be seen, the abandon rate was much greater for services than for sales and reservations.
Check the ACD’s Definition of Service Level
Not all ACD reports will provide an accurate picture of call abandon rates or service.
Some systems will not consider calls that hang up in the first five to ten seconds as part of their call abandon rate at all. This will mean the curve would be less steep as the number of abandoned calls used to calculate call abandon rate would be much lower than in reality.
Also, the service level percentage could be distorted because some ACD reports will automatically take into account call abandons in their service level calculations. This means that callers who abandon before the target queue time will be considered as “dealt with”, but ordinarily a service level would disregard these callers.
Greater Correlation Will Be Found in Bigger Contact Centres
The correlation curves that have the greatest accuracy are those created by the contact centres with the highest call volumes.
This follows the simple principle that the greater the sample size, the greater the accuracy of the results.
For example, a contact centre with only 20 advisors and low call volumes could see dramatic swings in abandon rates on an hourly basis, simply because of chance, with little change in service level. Yet, this is unlikely to happen in a contact centre with 1,000 advisors and high call volumes, as abandon rates at the target service level will be much more consistent.
Why Predict Call Abandon Rates?
While this is a fairly simple thing to do, not many contact centres predict abandon rates. But it can be useful to do so for two reasons:
To Provide a Good Indication of Customer Satisfaction
Despite being a staple of the contact centre for years, Customer Satisfaction (CSat) is still the most important metric according to our readers. This can be seen in the results of our poll below:
(This poll was sourced from the article: Customer Satisfaction Is Deemed the Most Important Measure of Success)
However, many contact centres still calculate this metric via surveys, which are not always the most reliable source of information. This is because of issues such as survey size, fatigue, scripting and so on.
So, why not bolster results by factoring in abandon rates, and see if there is a relationship between these rates and customer satisfaction?
Looking at past CSat results and relating them to past abandon rates will allow a contact centre to gauge how CSat results may continue based on abandon rate predictions.
Queue times can also provide a good indication of customer satisfaction, as highlighted in our article: Is There a Correlation Between Queue Time and Customer Satisfaction Levels?
To Highlight Loss of Revenue
With every abandoned call, particularly in a sales environment, goes another potential customer. Taking this into account, it is possible to predict how much money the company loses with each abandoned call.
This information could be useful to show advisors how much money the company is predicted to lose if the team drops its level of service, particularly if statistics such as service level and queue times are already being displayed.

Ric Kosiba
While this information could work well on wallboards, it is useful to show these figures to advisors because bringing money into the equation makes the statistics much more tangible. It could therefore become a motivational tool, as advisors see the real value of their service.
In addition, this can be a good static to show to the wider business to demonstrate the influence customer service has on profitability, and it could also be used when making a business case for greater investment in the contact centre.
[Follow the link to find out: What Information Should You Be Displaying on Your Contact Centre Wallboards?]
Thanks to Ric Kosiba from Genesys for helping to put this article together.
For more insights into call abandon rates, read our articles:
- How to Measure Call Abandon Rate
- 18 Simple Ideas to Reduce Your Abandon Rate
- How to Bring Down Your Call-Abandon Rates
Author: Robyn Coppell
Published On: 13th Sep 2017 - Last modified: 13th Aug 2025
Read more about - Workforce Planning, Abandoned Calls, Customer Satisfaction (CSAT), Editor's Picks, Genesys, Service Level, Workforce Planning


This is wonderful, thank you for the insight!