


In this article, we are going to look at one popular way that businesses measure brand loyalty.
Net Promoter Score (NPS) is based on the number of survey respondents who say they are likely to recommend a product or service, versus the number who say they are unlikely to.
In this article:
- How to Calculate NPS
- Is NPS Important?
- Improving Your Score
- NPS Pitfalls
- Using the Data
How to Calculate NPS
Step 1 – Word Your Question Carefully
Unlike other measures of consumer experience, NPS can be gauged by asking users a single question. This is usually phrased as “Would you recommend our service/product to friends?”
There are some small ways that the wording of the question can affect the result. For example, the question should be hypothetical, dealing with what the customer might do rather than what they definitely will do.
That means asking something like ‘would you’ rather than ‘will you’ or ‘are you going to’. It is generally advisable to follow the main question with a comments box, inviting the customer to go into more detail.
Customer survey expert Teresa Gandy advises that “You’re better off putting more in that is measurable – numbers and graphs that you can use – and having an ‘additional comments’ box for specific issues.
“This gives people the option if they’re feeling very passionate one way or the other. If they’re not, they’ll leave it blank. From the reporting side of things it’s a nightmare because you’ve got to go into the analytics of text comments.
“And, if a customer has left a text comment, you really should be going back to them, which makes it higher maintenance. It depends on what you’re trying to do with the survey.”
Step 2 – Conduct a Survey
Consider the basics of good survey design when soliciting feedback. Customers are only likely to commit around 90 seconds of their time, and generally prefer answering between three and five questions.
Remove any barriers to access, and rather than directing customers to your survey, take them there via links and post-interaction IVR.
“You need to ask your customer for feedback when they’re still mentally engaged with you – that’s on a sales call, or the evening they’ve spoken to you. The deployment of a survey is equally as important as the question you’re asking, and that’s what leads to success,” said Teresa Gandy
Step 3 – Separate the Responses into Three Categories
To arrive at NPS, customer responses are divided into three categories:
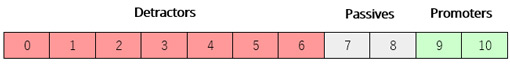
Detractors are somewhere between barely satisfied and actively dissatisfied with the service they have received. Far from recommending a business, they are likely to advise against using them.
Passives are reasonably satisfied and unlikely to have a strong opinion either way. Promoters are the brand enthusiasts that businesses need to be aiming for.
Some analyses have shown that reversing the order of the scores results in a higher average, as we found on our site visit to the AO contact centre:
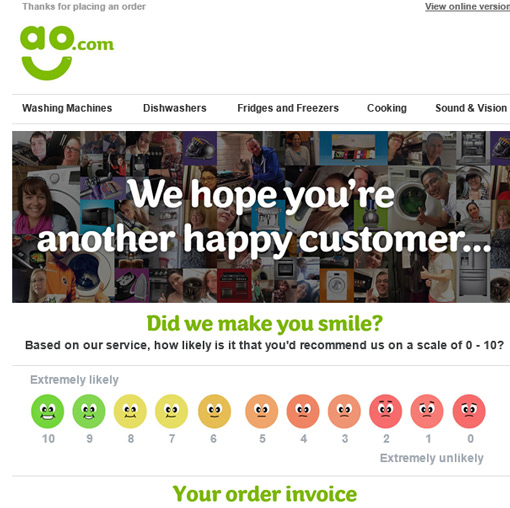
While it is generally inadvisable to manipulate survey results, there is no objective ‘right’ way in this case. The most important thing is to be consistent in whichever model is used.
Step 4 – The Equation
The calculation for NPS is very simple. To start, we disregard the passives and subtract the number of detractors from the number of promoters. The result is averaged against the total number of participants.

Our example survey gets 950 responses.

The result in this example is 13.7. As NPS is always represented as an integer between -100 and +100, we round the score up to 14.
Nominally, any positive score is good and any negative score is bad.
In reality, a score can only be meaningful when compared against either an industry benchmark, or the business’s own performance over time.
A complaint that is frequently made against NPS is that the passives (scoring 7 or 8) are not part of the calculation. This is a misunderstanding of how the score works – the impact of the passive voters is in the average against total respondents, so they are not really disregarded.
Is NPS Important?
NPS has been a key customer metric for many well-established companies since its creation in 2003. But it has been subject to criticism in that time – so does it matter or not?
We can break this in to three questions:
- Is it important to have promoters?
- Does a business need to measure customer sentiment?
- Is NPS the best way to achieve this?
The answer to the first two is clearly yes. Businesses need to have promoters to remain competitive, because these customers have a significantly greater customer lifetime value than others, and generate 80% of referrals in most industries.
And of course, when businesses don’t understand customer sentiment, they have no reliable information to guide strategy.
So factors related to NPS are important – but is an NPS survey the best way to understand them? Other common metrics of customer experience are Customer Effort Score (CES) and Customer Satisfaction (CSat). Both contain useful information about the customer experience, but neither aim to tell businesses much about the likelihood of referral.
The answer seems to be that a good mix of these measures is the only way to really understand customers. But there may be other ways that NPS can be useful.
Teresa Gandy told us, “I encourage people to use NPS because you get half a dozen pieces of quality data out of one question. It’s not just about how likely they are to recommend. It gives people things like their trend data, their target data, their referrals. Some people use it to inform their employee bonus.”
For more on the basics of NPS, read our article: What Is Net Promoter Score (NPS)?
Improving Your Net Promoter Score
In a sense, a business that aims to increase its NPS in isolation is missing the point. The score is a measure of customer sentiment, so improving the customer experience is the only meaningful way to get results.
Or as CX consultant James Dodkins puts it, “In a football match, the fans are the customers, and the successful outcome is a victory for their team. Scoring more goals is what a successful outcome looks like.
“You can measure shots, passes, and possession because they’re useful, but those aren’t the metrics that tell you whether you delivered success. If you understand what success is for your customers, you can measure the factors that contribute.
“The length or number of calls is important to look at, but not as important as delivering success.”
The reality is that businesses have a lot of difficulty with anything unmeasured. What they need to ask is what factors really drive NPS? If you’re measuring via surveys, you need to be able to ask what customers’ key problems are.

A Bright report found that these three factors had a great impact on NPS
Sourcing and leveraging this kind of NPS data will allow you to put lessons into practice in the right ways. If you receive agent-specific feedback, make the lessons there a part of ongoing personal development.
When we previously investigated healthy metrics to employ, CEO Paul White advised a mix of performance-related and task-related measures that support overall business objectives.
The question is, who benefits from working towards NPS at your business? Frontline staff, supervisors, or upper management?
NPS Pitfalls
1. Different Results Yield the Same Scores
Because of the way results are averaged, it is possible to achieve the same score with different input.
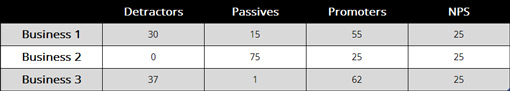
These businesses’ customers clearly have different feelings about each of them, yet their NPSs are all the same.
All three could learn something about their service from the breakdown of their customers – but does the NPS itself mean much?
2. NPS Groups Users with Different Experiences
Another issue with NPS is the way it groups respondents, as the three categories are not equally weighted. As a result, respondents who give a score of 6 are judged as having the same level of sentiment as those who score 0.
This does not correlate with real-world experience of consumer sentiment. There’s a simple way to look at this. If a customer scores a 6, you might be able to convince them to move up to a 7.
Is it likely that a customer who scored a 1 would also change to a 7?
3. The Score Might Not Mean What Businesses Think
Metrics are only as good as the lessons you learn from them. The data set around NPS can give a business a temperature check on how positive its customers are feeling.
But what about the score itself? Does it tell a business anything about the likelihood of getting referrals from its customers? The answer is… maybe.
Customers answer a hypothetical question to generate NPS, with little clear indication that their specific answer correlates to higher word-of-mouth marketing.
In fact, some studies have found a stronger correlation between Customer Satisfaction scores and referral activity than between NPS and referral activity.
4. The 11-Point Scale Is a Drawback
The NPS 11-point scale (0-10) has lower predictive power than other tested scales, as shown in analysis by Schneider et al.
(Measuring Customer Satisfaction and Loyalty: Improving the ‘Net-Promoter’ Score)
Their recommendation was to move towards a 7-point scale, as commonly used in other measures like Customer Effort.
Research from Loop11 demonstrated that even making one small change – using a 1–10 scale instead of a 0–10 scale – impacted the number of detractors by 6%.
Businesses would have to re-educate staff to make these changes. NPS is recognised across industries, so there could be numerous difficulties with benchmarking were they to change the scale. In fact, the score would not be recognised as an ‘official’ NPS if it was used a different scoring system.
5. Are Low Scores Really Detractors?
Finally, Forethought Research Australia has concluded that false interpretations are commonly drawn from NPS data. While the NPS question Would you recommend? is unipolar, the answers are interpreted as bipolar – high scorers recommend, low scorers detract.
The fact is, nobody who participates in a standard NPS survey says that they plan to publicly criticise a brand, yet that is one of the primary conclusions drawn from the data.
Using NPS Data
At the very least, measuring NPS is a symptom of a business’s eagerness to engage in improving the customer journey.
That’s a positive, so long as the business is careful to understand what the data are saying before acting on them. For a stable company, poorly interpreted data are probably worse than no data at all if it leads to unnecessary and harmful changes.
Survey design factors heavily into whether data are reliable. Customer experience author Jeff Toister often sees these four survey flaws:
- The survey is too long
- The survey asks useless questions
- The survey asks questions that you should already know the answer to
- Survey questions are intentionally written to influence a more positive score
His advice is to “Think ‘easy’ when deciding what media to use to send a customer survey. How can you make it easy for your customers to respond? How can you make it easy for you to deploy the survey and then analyse the data? There’s no one solution here since it varies by situation.
“A good customer service survey should yield useful, actionable information that helps you improve service. Sending a survey request is really asking your customer for a favour, so surveys should be as easy to complete as possible.”
For the contact centre, NPS is a very useful way to promote customer experience as an investment.
The figure itself – the integer between -100 and +100 – can be rendered meaningless by a variety of common factors. However, driving towards a higher score is a neat way to focus business objectives on VoC data and customer welfare.
The terms “Net Promoter Score” “Net Promoter” and “NPS” are registered trademarks of Fred Reicheld, Bain and Company, and Satmetrix.
With thanks to:
Teresa Gandy, Managing Director at Clarity CX
James Dodkins, Principal Consultant at BP Group
Jeff Toister, Author of the Service Culture Handbook

For more on how to calculate other key customer experience metrics, read our articles:
- How to Calculate a Customer Satisfaction Score (CSAT)
- How to Calculate Customer Effort
- How to Calculate First Contact Resolution
Author: Robyn Coppell
Reviewed by: Megan Jones
Published On: 28th Jun 2017 - Last modified: 15th Aug 2025
Read more about - Customer Service Strategy, Bright, Customer Feedback, Editor's Picks, How to Calculate, Metrics, Net Promoter Score (NPS), Service Strategy


Excellent explanatory article folks.
Best regards,
Liam
I would think of a NET PROMOTER’S VIEW rather than score. Clearly, the possible customer’s answers to the question WOULD YOU RECOMMEND? could be DEFINITELY NO, MAYBE NO, NOT DECIDED YET, MAYBE YES, DEFINITELY YES. So the percentage of respondents who answered the last option are considered as TRUE PROMOTERS. By the same token, those answered MAYBE YES could be considered as NEAR PROMOTERS. A paiwise comparison over time could be the task, and the potential shift from NEAR to TRUE could be a real challenge for a(ny) company. Please comment.Thank you