


Attrition rate is a key metric for contact centres, helping managers understand workforce turnover and its impact on operations.
By calculating attrition as a percentage using the attrition formula, businesses can identify trends, address retention challenges, and improve employee engagement.
In this article, we’ll break down what attrition rate is, how to measure and calculate attrition rates in the contact centre, and why it matters for effective workforce management.
Attrition Rate Meaning
What is an Attrition Rate?
Attrition is the rate at which members of staff leave the workforce over a given period of time. It is also known as ’employee attrition’, ‘employee turnover’, or ‘employee churn’.
Managers, team atmosphere, recognition programs, pay and benefits, mental health, and workforce demographics can all influence attrition rates. There are a number of proven ways to reduce attrition rates.
What Does a 10% Attrition Rate Mean?
For every 100 employees you have, 10 will leave over the course of a year. Similarly, if you have 50 employees in total, then five will leave. It is the fraction of people who will leave in relation to the full number of employees currently employed in your organisation.
How to Calculate Attrition Rate
The attrition rate calculation, also known as the attrition calculation, is relatively simple – and you can use this formula in Excel.
Here is the Attrition Rate Formula:
Attrition Rate % = (Number of employees that left during period) ÷ (Average number of employees for period) × 100.
The Cost of High Attrition
The danger with attrition rate is that it becomes just another percentage that managers occasionally pass their eyes over. Yet, in terms of real value, high attrition represents huge costs to organizations.
In terms of real value, high attrition represents huge costs to organizations
There are high costs in recruiting and training new staff; these are the direct costs of attrition.
But that’s not all…
The consequential costs of attrition can be about ten times greater than their direct costs when you drill into the details – including metrics like sales conversion, as Megan Jones, Editor at Call Centre Helper explains:
“You’ll probably find that the performance of a new sales employee compared with an experienced sales employee gives you a clear differential on success rates (until they reach similar levels of competence). This can amount to significant financial losses over the course of the year.
In many cases, when the cost of attrition is properly valued, it really gets everyone’s attention. It escalates the cost of losing people from a tens-of-thousands-of-pounds decision to a multi-million-pound decision.
This really helps when putting forward a business case for support in building a better contact centre culture, one of the keys to reducing attrition.”
For advice on improving your call centre culture, read our article: The Importance of Call Centre Culture and How to Improve It
What Is the Average Employee Attrition Rate in the Contact Centre Industry?
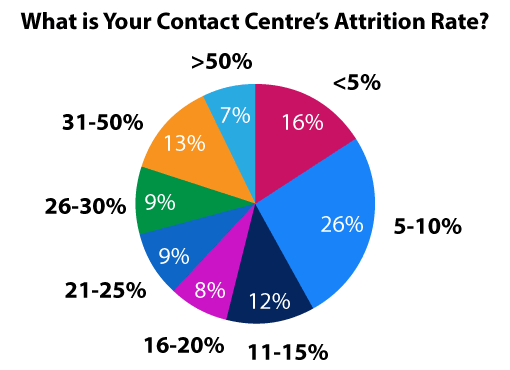
The UK Contact Centre HR & Operational Benchmarking Report
Attrition rates are high in contact centres (particularly attrition in BPO) when compared with other industries.
For example, a report by ContactBabel found that one in five UK contact centres have an attrition rate of over 30%.
In addition, advisors seem to leave the industry after a very short period. In fact, some studies indicate that half of the advisors who leave the profession do so within their first 90 days of employment.
Additional Attrition Rate Calculations
Here are 3 other ways to define attrition rate:
1. Involuntary Attrition Rate
Involuntary attrition is when a business dismisses employees. Involuntary attrition is normally excluded from attrition calculations and is calculated using the formula below:
How to Calculate Involuntary Attrition Rate Formula:
Involuntary Attrition Rate (%) = Number of employees that were terminated during period ÷ Average number of employees for period x 100.
2. Voluntary Attrition Rate
Voluntary attrition rates can be calculated using the formula below:
How to Calculate Voluntary Attrition Rate Formula:
Voluntary Attrition Rate (%) = Number of employees that left voluntarily during period ÷ Average number of employees for period x 100.
The voluntary attrition rate can be used alongside, and compared to, the total attrition rate and the involuntary attrition rate to identify trends and issues that may be causing staff to leave of their own accord.
It can even be compared to and tied into your new starter attrition rate to give an overview of voluntary leavers during the first 12 months.
3. New Employee Attrition Rate
The first six weeks of an employee’s tenure is the most expensive, and an advisor will usually draw more value than they add for several months.
However, the first six weeks is the period within which advisors are most likely to leave the contact centre.
So, if you want to find out what is causing advisors to leave in that first six weeks, this cannot be done using the conventional attrition equation. Instead, you’ll need to rely on the ‘new employee attrition rate’ formula, as shown below:
How to Calculate the New Employee Attrition Rate:
New Employee Attrition Rate (%) = Number of employees who have joined in the past 12 months AND left the Company ÷ Number of employees who have joined in the past 12 months x 100
That’s not all. It can also help to have a grasp on internal attrition (when employees move internally) and demographic-specific attrition (when people of a similar age, gender, or ethnicity leave). There are a number of ways to reduce new employee attrition rate.
Common Mistakes When Calculating Attrition Rate
‘Average Number’ vs ‘Total Number’ of Employees
A common mistake is to divide by the total number of employees – instead of the average number of employees.
How do you calculate the average?
This figure can be reached by taking the starting number of employees for the period, adding that to the finishing number of employees for the period, and dividing the result by two. For most, the period is a full calendar year.
So, for a company that began a year with 6,500 employees and ended the year with 6,380 employees, the calculation for average employees would be (6,500+6,380) / 2 = 6,440.
Calculating Attrition Rate Just Once per Year
When we define attrition rate, we typically talk about a single percentage calculated across a period of a year. However, this doesn’t mean that attrition rate is a metric that should be tracked only once per year.
Instead, it is better to calculate the metric on a rolling, week-by-week basis – with a moving average trend.
This means that in one week you would calculate the attrition rate for the past 52 weeks and then, in the next week’s calculations, the oldest week would drop off and the new one is added on.
This will give you much better insight into what caused the attrition – as opposed to just looking at an overall figure at the end of the year.
It can also help you immediately identify and address what caused a spike. (If it was avoidable, you can learn directly from the experience, so it doesn’t happen again.)
Presenting Attrition Rate to the Wider Business as Just a Percentage
The wider business will become much more interested in helping you to reduce attrition when you attach a cost to it.
That’s not just recruitment and training costs, but other things like vacancy costs, the costs of the team spending time helping new recruits, and so on.
You must bring the percentage to life to prove your case.
Separating Out Involuntary Attrition From Overall Attrition Rates
Be aware of the difference between voluntary and involuntary attrition rates – as also seen in the calculations above:
- Voluntary Attrition – When advisors leave of their own accord.
- Involuntary Attrition – Also known as ‘intentional attrition’ or ‘planned attrition’, this is where somebody is asked to leave the company. This is typically for performance-related or disciplinary reasons, as well as redundancy.
What’s the problem? Well, some managers choose to exclude involuntary attrition from the overall attrition figure, as it wasn’t the employee’s choice to leave. However, this isn’t always considered best practice, as involuntary attrition still represents a cost for the business.
It can even suggest a problem elsewhere, whether it’s a recruitment problem, a management problem, or a coaching problem.
Whatever the case, whenever somebody leaves the company, it should lead to a moment of soul-searching. Even if you just uncover that someone left for an exciting new opportunity, it’s still good to have sight of and understand.
Overall, the more insight you have, the better. So best practice advice is to have a handle on your voluntary, involuntary, and new starter attrition figures, as well as overall attrition rates, for a full and comprehensive picture of what’s happening on the frontline of your call centre.
For more advice on managing your teams, take a look at these articles:
- How to Make Exit Interviews Work for You
- Top 20 Ways to Reduce Attrition in Your Contact Centre
- How to Calculate Absenteeism
Author: Megan Jones
Reviewed by: Robyn Coppell
Published On: 8th Sep 2023 - Last modified: 13th Aug 2025
Read more about - Workforce Planning, Absenteeism, Attrition, Editor's Picks, How to Calculate, Metrics, Workforce Planning


Good To see