


We investigate how to measure and calculate forecast volatility in the contact centre.
What Is Forecast Volatility?
Volatility is a measure of the unpredictability of contacts coming into the contact centre. In essence this is the “spread” of data around the average.
In terms of contact centre forecasting, your data will be historic contact volumes.
You can analyse volatility in your contact volumes across days, weeks or years. It depends on your intended outcomes.
Why Should You Measure Forecast Volatility?
It is unrealistic to expect 100% forecast accuracy because there is always randomness around the moment that somebody contacts you. It is the goal of a planner to minimize the inaccuracy.
That is, however, easier said than done as human beings are random by nature and the planner has to try and predict that randomness.
“Planners try to make sense of these patterns within the randomness. This is where volatility comes in as it shows the extent to which the randomness stretches the patterns,” says John Casey, Resource Planning Expert at CCplanning.
Knowing these patterns and predicting a certain level of volatility helps a planner to minimize the inaccuracy within their staffing plans.
To Calculate Forecast Volatility Use Standard Deviation
The first thing to consider when calculating forecast volatility is to define the time period over which you will measure it. Will it be a day, month or year?
So, let’s take a week’s contact volumes and find the daily forecast volatility through standard deviation.
The table below shares an example of daily contact volumes across the week.
| Day | Contact Volume |
|---|---|
| Monday | 90 |
| Tuesday | 80 |
| Wednesday | 77 |
| Thursday | 78 |
| Friday | 75 |
| Average (Mean) | 80 |
The mean would equal 80. We worked this out by simply adding each day’s contact volume (400) and dividing it by the total number of days (5).
We use this mean to work out the standard deviation, by using the following formula:
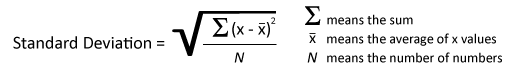
In this example the average of the “x values” is 80 and “N” is equal to 5, as that’s the number of pieces of data that we have.
So, let plug in all of our values into this formula:
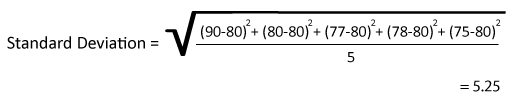

This technique was put forward by Lucien Hughes, a Business Transformation Consultant.
“Similarly, the root mean squared error can be used to measure the accuracy of said forecast relative to actuals on a daily level,” adds Lucien.
To find out how to measure forecast accuracy in the contact centre, read our article: How to Calculate Forecast Accuracy
Another Approach Is to Calculate a Percentage
If you want to calculate volatility as a percentage and not as a numeric value, this may be the method for you.
For this example, let’s calculate forecast volatility across the year.
In this year, you may expect to receive 52,000 calls.
Now, those calls are not going to arrive evenly. Some weeks you may receive 1,300 calls, others 800. But they average in and around the anticipated 1,000.
To find our forecast volatility, we can plug these numbers into the following formula:
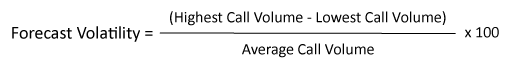
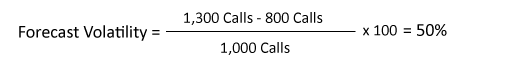
This volatility can help a planner to set upper and lower bounds for what they can expect from future forecasts.
After all, a planner should not be creating just one forecast; all our forecasts will have a certain amount of uncertainty within them. You need to understand your best and worst-case scenarios and know how you can cater for them.
Know the Costs Behind Volatility
The main motivation behind calculating forecast volatility is around accounting for your costs.

“Key is understanding the cost of volatility,” says John Casey.
“How many staff does it represent and what is the cost of serving that? Is it worth it? Could enough extra revenue be generated on the highs to justify staffing towards that level?”
Think about a product like insurance. With sales, it is a limited-time service, and once the customer has purchased they are lost for at least a year.
So, if we frequently see spikes towards the top of the volatility limits then a discussion is needed on whether extra staff costs is balanced with extra sales. However, the opposite is true in cost centres.
Every time we go towards the lower extremes of volatility then we potentially have staff with limited work to complete.
Now the discussion is around whether cost savings are achievable and what they would mean to service targets when volumes are at or above the mean average.
Build Behaviour Profiles
There are certain “noise factors” that will increase contact volumes. For example, bank holidays will have a different behaviour profile from an average day.
Once you identify these noise factors you can estimate the impact that they will have on your forecast by analysing the volatility within your historic contact volumes when these events have happened in the past.
Then build that into your modelling.

“One example is weather. I worked for a plumbing and drainage organization where, if we had frost, then pipes would freeze up.
The following day, when they thawed, there would be a lot of leaks because the pipes would expand, causing ruptures,” says Vatsana Gordon, a Consultant at Avocado 55.
“So we did we a lot of forecasting as to whether or not we would get frost and therefore an increase in contacts.”
Other noise factors that may apply to your contact centre include:
- Customer sensitivity
- Holiday periods
- Marketing promotions
- Product and/or service changes
- Product and/or service launches
Using volatility to determine the potential impact of these noise factors and identify the possibility that they will occur is a key part of contact centre forecasting.
For more on the fundamentals of forecasting, read our article: A Guide to Workforce Forecasting in the Contact Centre
The Key Rule: Never Just Build One Forecast
The key to measuring forecast volatility is to minimize inaccuracy within your forecasts. The measure allows you to set upper and lower bounds for your expected contact volumes.
Why is this important? Because we shouldn’t just be guessing what might happen by planning based on one estimation. Remember, all forecasts contain a certain amount of uncertainty. We want to be fully prepared and to do that we should be making multiple forecasts.
Uncertainty can be particularly high if you created your forecasts months ago. New situations that you may never have previously thought of may arise that impact your forecasted contact volumes.
By using your volatility rate and applying that to your forecast, you can create three forecasts; an upper-, middle- and lower-level forecast. This will help you to prepare for a change in why and how customers want to contact you.
For more on the topic of calculating key WFM metrics, read our articles:
- How to Calculate Contact Centre Service Level
- How to Calculate Contact Centre Shrinkage
- How to Measure Call Abandon Rate
Author: Robyn Coppell
Reviewed by: Hannah Swankie
Published On: 8th Mar 2021 - Last modified: 28th Jul 2026
Read more about - Workforce Planning, Forecasting, How to Calculate, Workforce Management (WFM), Workforce Planning