


Forecast accuracy is vital for creating schedules that match agent availability with customer demand, as Chris Dealy explains:
“Forecast accuracy, I mean when it comes to forecasting, the rubber really meets the road when the time comes to build shift schedules for your agents.
You want schedules that consistently match the supply of agents with demand from customers, and you need to take into account the peaks and troughs across the days of the week, and the weeks of the month, and so on, and the M curve, or whatever, across each working day.
That at the end of the day is why we do forecasting.”
To find out more, we asked Chris Dealy, WFM Evangelist at Peopleware (formerly injixo), to explain how contact centres can measure forecast accuracy and improve it effectively.
Video: Methods to Calculate Forecast Accuracy
Watch the video below to hear Chris outlines the methods that contact centres can use to calculate forecast accuracy:
With thanks to Chris Dealy, WFM Evangelist at Peopleware (formerly injixo), for contributing to this video.
Six Tips to Calculate Forecast Accuracy in Contact Centres
1. Take a Snapshot of Your Forecast
The first step is to save a snapshot of your forecast when you create agent schedules, you can do this manually, but a good workforce management application will have the means to do that.
This snapshot will provide a reference point to compare against actual outcomes.
“So you should start by taking a snapshot of your forecast at the moment you use it to create schedules.
Now a good workforce management application will have the means to do that. In injixo it is called ‘Forecast Versions’.”
2. Compare Actuals with the Forecast Snapshot
After the scheduling period, compare the actual data with your saved forecast. Be cautious with averages, as they can be misleading.
“So the second step is after the event, so the days arrived, the weeks arrived, and you want to compare the actuals with what you saved in the forecast snapshot. Now a tip here is to be careful in choosing the evaluation timeframe.
Averages are dangerous – if I put my head in the oven and my feet in the freezer, on average I’m comfortable.”
For instance, high volumes in one interval and low volumes in another might cancel each other out. These are known as compensating errors, so if you’re just looking at daily or weekly totals your forecast will probably look more accurate than it is.
Evaluating data in smaller intervals, such as 15-minute blocks, can give you a clearer picture.
“Of course, it doesn’t work out like that. On a typical day there’ll be some intervals that have got more volume than your forecast, and other intervals with less volume than your forecast, and these two can cancel each other out.
That’s called compensating errors. So if you’re just looking at daily or weekly totals your forecast will probably look more accurate than it is.
So what I recommend is to use a technique for measuring forecast accuracy, and what you’re fundamentally doing is you’re comparing the numbers in two columns, the forecast and the actual column.
If you’re into statistics you can find all sorts of techniques for doing that comparison to the two columns.”
3. Use MAPE
Using Mean Absolute Percentage Error (MAPE) to measure accuracy allows you to calculate the absolute percentage error for each interval and average it across the day.
It’s simple to set up in a spreadsheet and provides clear, actionable insights. If you’ve got a centre with at least 100 agents in, you should be aiming for within 5%, so a Mean Absolute Percentage Error of 5% or less.
If you’re a bit smaller than that, because you haven’t got the safety in numbers, then 10% is a reasonable target for a smaller centre.
“There’s something called standard deviation which is measuring the amount of noise or spread in a sample of data, and the bigger the number, the more the spread.
You could use correlation coefficients where you know a perfect match, a perfect accurate forecast, gives a score of one, plus one, and complete inaccuracy is minus one.
The thing is, it’s quite difficult to interpret the results of those comparison, so I recommend using something called MAPE, Mean Absolute Percentage Error.”
The image below shows the scary mathematical formula for MAPE and an example showing at 15-minute intervals forecast compared with actual, looking at the absolute percentage error in each interval, and then averaging that across the day to give you a figure.
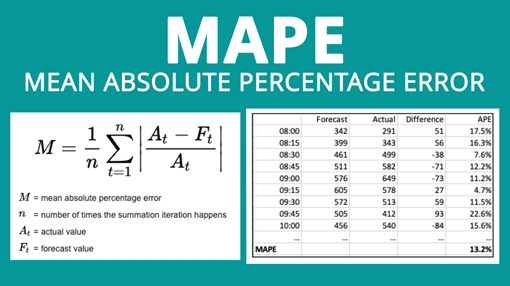
“And there’s a little example there showing at 15-minute intervals forecast compared with actual, looking at the absolute percentage error in each interval, and then averaging that across the day to give you a figure.
So that’s my first tip: use Mean Absolute Percentage Error, it’s powerful and easily understood.”
4. Don’t Forget Average Handling Time
Accurate forecasting isn’t just about volume. Average Handling Time (AHT) is equally important. Make sure you include AHT when calculating your workload to get a realistic forecast.
“Another tip is don’t forget average handling time, it’s just as important when working out your workload, just as important as as volume.”
5. Know What Good Looks Like
Setting goals for what good looks like means you can judge where your forecast is off. Setting MAPE targets based on contact centre size, allows you to judge where you may be off.
“Another tip is what does good look like? Well, if you’ve got a centre with at least 100 agents in, you should be aiming for within 5%, so a Mean Absolute Percentage Error of 5% or less.
If you’re a bit smaller than that, because you haven’t got the safety in numbers, then 10% is a reasonable target for a smaller centre.“
6. Understand the Causes of Deviations
Identifying the reasons for any differences between your forecast and actuals is key to improving accuracy. By analysing the causes of deviations, you can adjust your approach and avoid similar errors in the future.
“And the final tip for measuring is you’ve got to find the cause of deviations so you can avoid them next time.”
If you are looking for more great insights from the experts, check out these next:
- Tips to Reduce Call Queue Time
- Self-Service and Why Contact Centres Should Offer It
- What’s the Difference Between Empathy and Sympathy?
- Tips to Reduce Repeat Contacts
Author: Robyn Coppell
Reviewed by: Hannah Swankie
Published On: 28th Nov 2023 - Last modified: 25th Sep 2025
Read more about - Video, Chris Dealy, Forecasting, Peopleware, Top Story, Videos