


Here are ten things that you need to be aware of when scheduling staff, but may not already know.
1. Calls Are Not Distributed Evenly Around the Average Handling Time
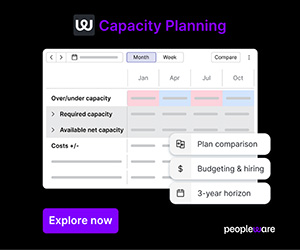
If a contact centre’s Average Handling Time (AHT) is five minutes, calls will be distributed this:
Right?
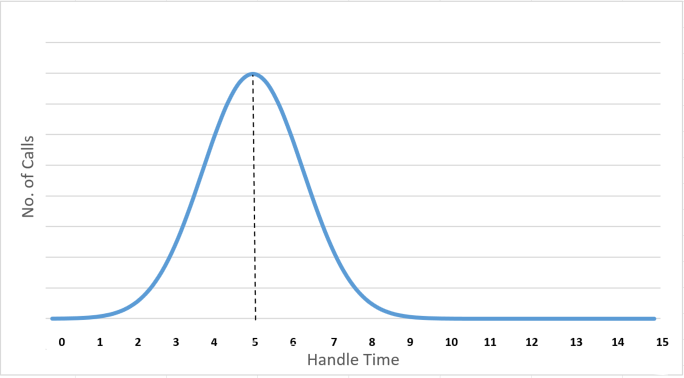
Wrong. In fact, calls are distributed using a logarithmic case of a Poisson distribution model called the Erlang Distribution, which looks like the following:
This means that, whilst there are a lot more short calls, there are also a few with a much longer duration, which your contact centre must be prepared for.
It is because of this distribution that many people think that using an Erlang Calculator overstaffs the contact centre. But really it is producing a number that ensures contact centres can meet their targets, no matter what the circumstances.
Find out more on this subject by reading our piece: How Is Average Handling Time Distributed? It is not how you think!
2. Call Volume Spikes Around the Hour Mark

David Appleby
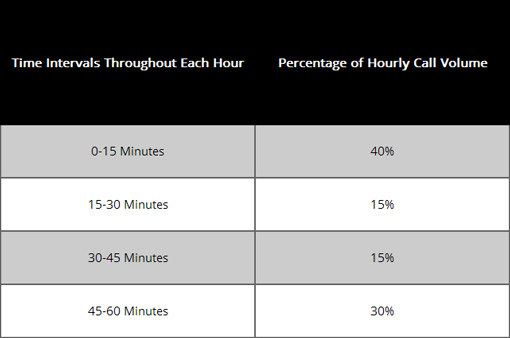
According to David Appleby, “It is human nature to look at the clock and ring after it strikes the hour.” Furthermore, this is often the time that meetings, television shows etc. finish.
So, call volumes in contact centres tend to spike around the hour mark, as David’s research concluded.
In fact, David also found that at least 40% of hourly calls fall within the first 15 minutes of the hour. Then, 30% of hourly calls would lie within the next half an hour, with the remaining 30% coming through during the final quarter of the hour, as shown in the table below.
On observing this pattern, the obvious thing to take from it would be to shorten your resource-planning periods. Perhaps moving from every 30 minutes to 15 minutes instead.
3. Many Contact Centres Are Neglecting the Impact of “Overhang”
Whilst switching to a 15-minute reporting period is advisable in some contact centres, as noted above, it should only be done if your AHT is under seven and a half minutes.
This is because it would otherwise break the principle that contact centres must ensure that their reporting period is at least double their AHT, due to the effects of overhang.
Overhang includes the calls that “run on” from the previous reporting period, as highlighted in the diagram below.
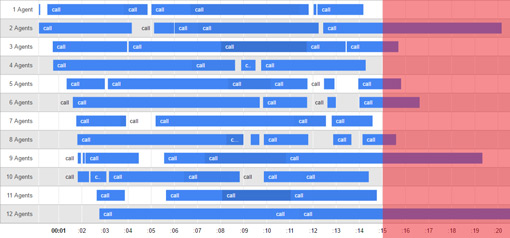
(This image above was taken from our Experimental Multichannel Contact Centre Calculator Tool)
As you can see, whilst it takes some time for the traffic to build up, it also takes time for the traffic to ease away. So, when you make staffing calculations, make sure you think about the ongoing calls from the last reporting period, and ensure that period is at least double your AHT.
4. Maximum Occupancy Should Not Exceed 85-90%
Maximum occupancy is the percentage time that a contact centre advisor spends handling customer contacts. This percentage time should be targeted, just as you would with a certain service level.
Generally, maximum occupancy rates should not exceed 85%, as targeting any more than this will increase advisor churn and increase advisor burnout. AHT would also increase, as advisors instead take their break time on call, which leads to the adoption of undesirable behaviours, such as putting the caller on hold to use the toilet.
Whilst this is not a great issue in smaller contact centres, larger establishments must pay careful attention to their maximum occupancy rates. This is because occupancy grows with contact volumes, meaning that the number of calls that each advisor receives, also increases, as highlighted below.
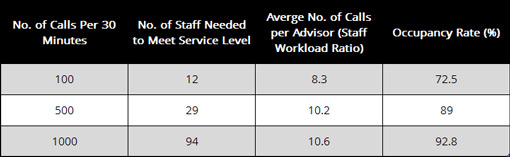
(We calculated these figures using: Average Handling Time = 180 secs, Reporting Period = 30 mins, Service Level = 80% and Queue 20 secs)
To discover the full effect that maximum occupancy has on staff numbers, read our article: How to Work out How Many Staff You Need in a Contact Centre
5. Always Account for Shrinkage in WFM Calculations
It is vital when making any workforce management calculations to account for shrinkage, the amount of paid time that a staff member is not available to work despite being scheduled to do so.
According to Dimension Data in their Global Benchmarking Report, the average figure for shrinkage is 35%.
This is an overall figure that includes internal shrinkage, when advisors are in the contact centre but unable to take calls due to breaks, meetings etc., and external shrinkage, when advisors take time off work due to holiday, absenteeism etc.
Ric Kosiba, Vice President at Genesys‘ Decisions Group, says separating the two for workforce management purposes is important. So, Ric recommends “looking at shrinkage that you can control and shrinkage that you cannot, because one requires forecasting and the other requires planning.”
Follow the link to find out: How to Calculate Contact Centre Shrinkage
6. Certain Staffing Models May not Be Right for Your Environment
Whether you use an Erlang Calculator, simulation model or a workload calculation, it is important to validate your chosen method, for overall confidence and buy-in from senior management.

Ric Kosiba
Ric says that “it’s a very simple process. All you need to do is take what happened last week, as you know how many people you had, what your call volumes were, what your handle times were and see if it was able to predict the service that you provided.
“Go through the process of proving that your models are right, and, if they are, publish it! Show your senior management ‘look, here is our planning, look how accurate it is.’ People will then have more confidence in your planning process and your ability to do analysis.”
7. Many Erlang Calculators Can Produce Errors
Many people use Erlang Calculators downloaded from the internet to calculate how many staff are needed in their contact centre, but many of these contain errors that are difficult to spot!
This is because many Erlang Calculators become unpredictable once results go above 142 advisors, often not revealing that there was an error in the calculations and thus returning wrong results.
Find out how to check if the Erlang Calculator that you are using is faulty by visiting our article: What Is an Erlang Calculator?
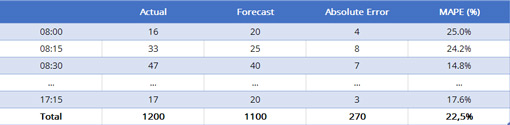
8. Use MAPE (Mean Absolute Percentage Error) When Forecasting
When forecasting call volumes, it is easy to assume that calls will be spread evenly throughout the week. So, if you receive 5,000 calls in a week, you might put enough staff in place to handle 1,000 calls in a day. But, in actuality, the spread of call volumes is very different, as highlighted below.
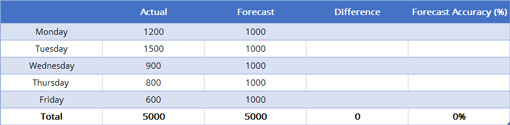
So, by forecasting this way, your Absolute Error will be considerably off, because if you are 200 calls off on Monday and 500 on Tuesday etc., as in the table below, and your MAPE will be very high. This means that you are unlikely to meet service-level, maximum-occupancy and queue-time targets on certain days, and on others you will be overstaffed.
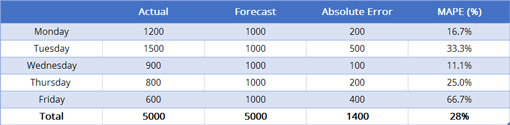
To get a time degree of forecast accuracy, you should do it by interval (15-30 minutes), rather than by day.
9. Using a Set Average Handling Time Throughout the Day
There are many causes for a change in AHT and time of day is one of them.
Nathan Winstanley, Operations Manager at Clearanswer Call Centres, has recognised this and advises against using “a set AHT for the full day with your intra-day planning.
“If you run your staffing in 15- or 30–minute intervals, change your AHT expectations throughout the day.
“An example would be in an inbound sales environment you may see a spike in sales in an evening, more sales = more calls, meaning your AHT in that period is higher. This means that if you run on a set day AHT, you may understaff your evening.”
Many contact centres also change AHT in accordance with temperature, as better weather often means that customers are less willing to spend large amounts of time on the phone.
In addition, in many 24-hour contact centres AHTs are often longer in the evening, due to people being more willing to spend time on the phone during this period of the day.
10. Spreadsheets Can Work Well in WFM Calculations, But Only for 35 Advisors or Fewer
Spreadsheets are a great method for smaller contact centres to generate WFM calculations in a cost-efficient manner. But, the general rule of thumb is that they only remain reliable for up to 35 advisors.
This is why many contact centres combine their spreadsheets with WFM software, as evident in the poll below. In fact, with 46% of the vote, it is the most common method for forecasting in the contact centre arena.
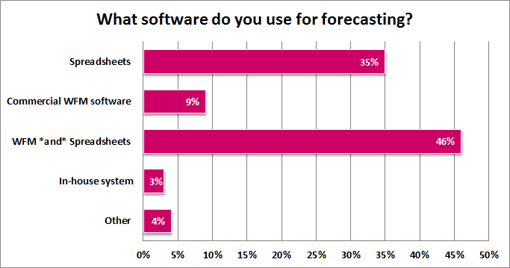
(This information was taken from our piece: Spreadsheets Do not Replace WFM for Forecasting)
Do you have any more tips on the subject of Workforce Management that you may like to reveal to us?
If so, please leave them, as well as any other thoughts, in an email to Call Centre Helper.
Author: Robyn Coppell
Reviewed by: Megan Jones
Published On: 5th Jun 2017 - Last modified: 13th Aug 2025
Read more about - Workforce Planning, Average Handling Time (AHT), Erlang Calculations, Genesys, How to Calculate, Occupancy, Scheduling, Shrinkage, Staffing, Workforce Management (WFM), Workforce Planning


Great article, thanks for putting it together! I found it very interesting that more calls tend to happen right on the hour, within the first 15 minutes. I had not heard that before. Also, I do have a comment about spreadsheets only being excellent for 35 or less agents. I have seen things like SS Schedules on SpreadsheetScheduler.com that are very powerful programmed spreadsheets that make it effective to still use spreadsheets for scheduling well over 100 agents.
Thanks again, great article!
Good to know these tips. I am also wanting to know why the speadsheet is only reliable to 35 advisors.
It is because of the limitation of the Erlang formular or Exce functions. But I see the Free Erland staffing sheet here is using Macro. It should be robust. Will you please explain in more details why.
2. Are you suggesting to calculate forecasting in small interval, 30 mins or 1 hour?
3. You also mention ‘simulation model’ I am quite interested in. DO you have working example/model? How is it constructed? Any articles/whitepapers available to share? thanks