


Customer satisfaction (CSat) scores can be great indicator of overall performance, but how can they be used to benefit the contact centre?
For maximum value, you need to know how satisfied the customer is with different parts of your service, so you know exactly where you need to improve. Let’s call these performance dimensions.
Splitting Customer Satisfaction
We need to look at how customers rate different dimensions of our service, to understand which have the greatest impact on overall CSat.
However, we can’t expect customers to sit through a post-call survey and be questioned about every single dimension of the service that they have received. So a focused periodic survey designed to test specific dimensions that you’re interested in is a great solution.
If the survey gets lengthy, you can provide incentives for customers to complete it. You could also choose to conduct customer focus groups.
How many service dimensions you test will depend on how long you want your survey to be or how long your customers are willing to sit there and answer lots of questions in a focus group.
Tom Vander Well
According to Tom Vander Well, CEO of Intelligentics: “How many service dimensions you test will depend on how long you want your survey to be or how long your customers are willing to sit there and answer lots of questions in a focus group. But, typically, our research team will whittle it down to about 10 or 15 dimensions.”
A focus group might start with a question such as: “What do you think good customer service looks like?” By asking questions like this, you can identify what matters most your customer. However, for the best results, it is best to employ the help of a professional research and QA firm.
For more of a simple introduction to CSAT, read our article: What Is CSAT? – With a Meaning, Calculations and Great Tips
Key Drivers and Supporting Attributes
Once you have highlighted what matters most to your customers, you will have attained a set of key drivers to satisfaction, specific to your customer base. Each driver is considered a dimension of your service.
However, you may also find that some of the dimensions identified can be split into separate drivers.
For example, if resolution is a key driver of satisfaction for your business, which it likely is, it can be split into more specific dimensions such as offering the right solutions to fit the need and listening to really fit the need.
These two factors can be defined as the “supporting attributes” of resolution, as they are linked very closely to the customer’s perception of resolution and help to bring the idea of “resolution” to life.
The supporting attributes of each key driver can then be listed, so that you have a collection of key elements that make up your customers’ satisfaction.
Quadrant Analysis Interpretation
With your list of supporting attributes, survey your happy volunteers and ask them to answer the following two questions for each supporting attribute.
- How important is this attribute to you, on a scale of one to ten? – Find an overall average (mean) score for each supporting attribute.
- How satisfied are you with this attribute of our service, on a scale of one to ten? – Create a satisfaction score (%) as you would when calculating overall CSat, but for each supporting attribute.
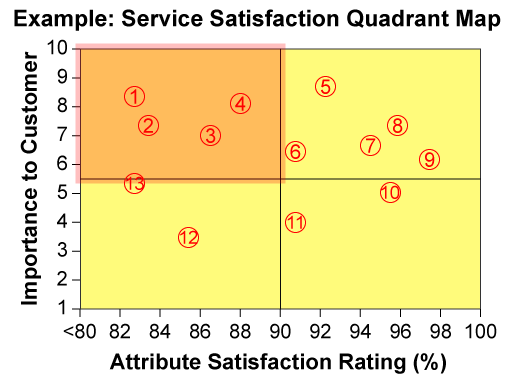
With these two scores for each supporting attribute, plot each attribute onto the grid below, which is otherwise known as a “Service Satisfaction Quadrant Map”.
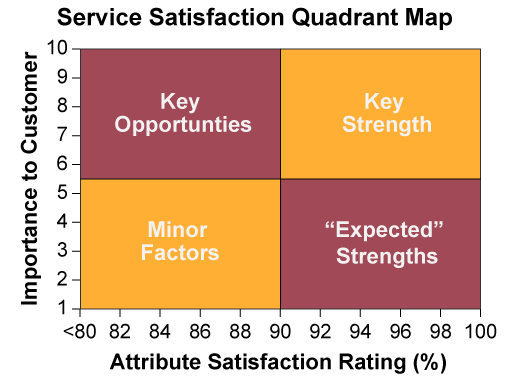
This map is recommended by Tom Vander Well, who suggests that once you plot your supporting attributes on this grid, group those that land in each of the four grids as so:
Key Opportunities – This segment is for attributes with high importance but lower performance ratings. You should put a lot of your time, energy and resources into improving the attributes that land in this section of the map, as these are the keys to boosting overall satisfaction.
Key Strengths – This area is for attributes with high importance and performance ratings. For these attributes, you should simply focus on maintaining strong performance.
Minor Factors – This section of the grid is for attributes with low importance and low performance ratings. It is better to direct your resources to improving your “key opportunities” rather than these factors, as they are of less significance to the customer.
“Expected” Strengths – This segment is for attributes with high performance ratings but which have a low impact on overall satisfaction. While it’s good to maintain adequate performance in these areas, direct improvement efforts should be directed towards your “key opportunities” or “key strengths”.
To bring this grid to life, here is an example of how each attribute can be plotted on the service quadrant map.
| Key Opportunities | |
|---|---|
| 1. | Quickness in reaching an advisor |
| 2. | Timeliness of follow-up |
| 3. | Offers appropriate solutions |
| 4. | Resolution |
| Key Strengths | |
| 5. | Clear, knowledgeable advisors |
| 6. | Answers without transfers |
| 7. | Efficiency of locating account information |
| 8. | Courtesy / friendliness |
| 9. | Listens without interrupting |
| Expected Strengths | |
| 10. | Avoids technical jargon |
| 11. | Recognises you by name |
| Minor Factors | |
| 12. | Open when needed |
| 13. | Ease of finding the right contact details |
This exercise is really useful in prioritising what you need to do to increase customer happiness.
For example, a contact centre may be wanting to find out the value to their customers of staying open 24/7, or over weekends. But if this contact centre creates the grid above, they would see that this was only a minor factor in satisfaction, as highlighted by point 12 on the map, and there were other – more cost-effective things – they could do to boost satisfaction further.
In fact, sticking with this example, we can see that if the contact centre were to focus their resourcing on staffing the contact centre during the current opening hours, this would better satisfy their customers, as highlighted by point 1 on the graph.
For more techniques to improve your C-SAT score, read our article: 5 Great Methods to Improve Your Customer Satisfaction Score.
Using This Analysis to Improve Your Quality Monitoring Scorecard
While using the service satisfaction quadrant map is great for prioritising which contact centre processes need the most improvement, it can also be used to improve advisor quality.

Tom Vander Well
As Tom Vander Well says: “The position of the attributes on the map are great when it comes to weighting the scorecard criteria, as it tells you which behaviours are more important from a customer perspective.”
“So, when I’m creating my scorecard I can clearly see which things need to be weighted more heavily in the calculation of overall performance, just by taking a look at the top quadrants. This will help you to better align customer satisfaction and your quality scores.”
While other business priorities like compliance also need to be included, if you can correlate quality scores and CSat, you will be scoring advisors “through the eyes of the customer”.
To check how effective you have been in doing so, plot individual post-contact satisfaction scores against the quality score from the same call onto a graph. If you can find a line of best fit, for when your quality scores increase so do your CSat scores, the two are well aligned. This is a technique called regression analysis.
Regression analysis is a technique that is used by the DAS contact centre in Caerphilly. To find out more, read our article: 15 Things You Can Learn from the DAS Contact Centre
In Summary
While most contact centres will consider CSat to be a very important contact centre metric, it’s difficult to attain any actionable insight from an overall percentage.
However, if you can identify the key drivers of CSat and score them individually on their importance to the customer and how you are currently performing in this area, you can highlight key opportunities to improve your service.
Also, by find out what matters most to the customer, you can improve your quality scorecards so that your view of an advisor’s performance best matches the view of the customer.
For more articles with insights from Tom Vander Well, read our articles:
- Call Centre Quality Parameters: Creating the Ideal Scorecard and Metric
- How to Calibrate Quality Scores
- 10 Best Practices for Quality Monitoring
Author: Robyn Coppell
Reviewed by: Megan Jones
Published On: 10th Oct 2018 - Last modified: 14th Aug 2025
Read more about - Customer Service Strategy, Customer Satisfaction (CSAT), Editor's Picks, Metrics, Performance Management, Quality, Service Strategy, Tom Vander Well