


There are three main groups of metrics that should be used for live chat. These are real-time, historical and customer metrics.
In many ways, live chat is similar to the phone, as Paul Weald, the director at mcx, says: “What you want by way of measuring chat is fundamentally no different from any other real-time channel in the contact centre.”
“Assuming that voice is already in place when you introduce chat, you should be considering what information you want to mirror, in terms of improving performance and resource planning.”
However, there are metrics, such as “number of concurrent chats”, which are unique to live chat.
So, let’s take a look the three metric groups highlighted earlier and make recommendations as to the individual metrics that have the most significance to the live chat channel.
Real-Time Metrics
Real-time metrics provide an immediate view into the current demand of the contact centre. This group of metrics is important for two separate groups of people.
First is managers and perhaps team leaders. If contact volumes are higher than expected across each channel, managers need to take control of the situation. This means they also need to keep an eye on real-time metrics to monitor their progress.
The second is the member of the workforce management (WFM) team who is in charge of intraday management. Paul says: “This person will need a view of current demand across each channel in the contact centre. They need to constantly monitor these metrics so they can move advisors and skills across the floor to meet demand.”
However, it is debatable whether the following real-time metrics should be accessible on advisor dashboards and wallboards. Pushing advisors on these “time-based” metrics may lead to the development of negative behaviours, such as rushing through calls, which impacts customer service.
So, it may be better practice to feed customer metrics back to advisors, while access to the following real-time metrics is predominantly meant for the WFM team and managers.
1. Service Level
Each channel will have a target service level. These service levels will help the WFM team to compare the real-time demand for live chat with voice, email, social media and so on.
In many contact centres, the target is 80% of live chats “answered” within 45 seconds, although we see a significant number of contact centres giving live chat the same service level as voice.
2. Number of Chats Queuing
This metric gives a greater idea of demand for the live chat channel and helps to give greater insight than just service level alone.
3. Number of Chats in Progress
Measuring this enables you to better understand and manage advisor workload over the course of the day.
4. Status of Advisors / Advisor Availability
If a number of advisors are “available” for a fair while, it may be better to ask advisors to switch channels to one with a greater current demand – if they are multiskilled, of course.
5. Real-Time Abandon Rate
This gives you a percentage of customers who abandon the queue before being served. It can be good to measure in real time, as it adds perspective to a declining service level.
6. Number of Elevations
In other words, how many times is another channel added to a chat interaction. High numbers may indicate that chat is not the appropriate channel for resolution of the particular issue.
7. Number of Concurrent Chats
One real-time live chat metric that contact centres often calculate is number of concurrent charts, thinking that it’s best to ensure that advisors are handling a certain number of chats at any one time.
Is Measuring the Number of Concurrent Chats Important?
Paul says: “The number of concurrent chats shouldn’t be based on targeting a specific number, but it should ideally depend on how complex the processes that are being undertaken are.”
As Paul is alluding to, if it’s a relatively simple process, multiple chats are fine. But if a thorough investigation is needed or the advisor is talking to an emotional customer, handling one chat at a time is often better practice.

Paul is currently working with one digital company who have the view that “every agent should have the ability to take two chats at a time. But they also have a button that they can press if they’re on a chat that requires their full attention.”
“By using the button, the agent’s status is changed to ‘currently busy’ and they won’t get delivered a second chat request.”
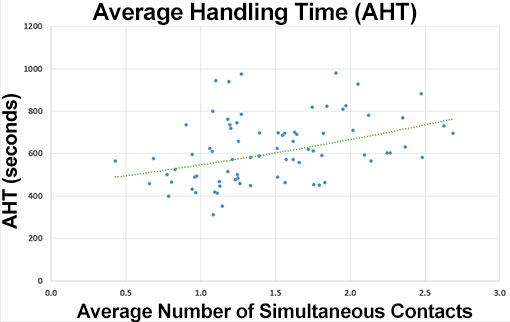
This innovation is a nice reminder to avoid getting overly concerned of the number of concurrent chats. If you like to measure this for the financial benefits of concurrent chat, remember that Average Handling Time (AHT) goes up with concurrency, so these benefits may not be as great as they seem.
In fact, Mathew Jardine, a Strategy and Planning Manager at Interflora, investigated the relationship between AHT and concurrent chats, creating the graph below in the process.
To unearth more myths about live chat, read our article: 10 Things They Won’t Tell You About Live Chat
Historical Metrics
These metrics are especially important to the WFM team, to provide historical data that improves future forecasts.
However, Paul Weald also says: “Individual advisors may want to know how many chats they have completed today, for example, and the manager would also like to see that information for each member of the team.”
So, let’s look at some of the key historical metrics that you should be calculating for live chat, to help track your progress in meeting organisational objectives, including reducing costs and so forth.
1. Chat Engagement
This is a measurement of the percentage of people that visit your site that “bounce” into a live chat conversation. Knowing this percentage will help you to forecast. In essence, it is the ratio of website visitors to page views.
2. Forecast Accuracy
Live chat is tricky to forecast and you need to test that you’re accurately predicting contact volumes. Calculating this metric helps you to assess the validity of your forecasting method as you move forwards.
3. Number of Chats Handled
Keeping track of this metric over time will help you to record contact volumes, to better understand advisor workload and to forecast more accurately, as you develop a better understanding of advisor workload.
4. Average Handle Time (AHT)
The main purpose of keeping of historical chat handling times is to calculate an average to help schedule advisors on the channel. However, do remember that AHT has a greater variance on chat than on the phone, so you cannot use an Erlang Calculator for scheduling, as you would on the voice channel.
Another reason for measuring AHT is to measure the efficiency of handling multiple chats or channels at the same time.
5. Average Number of Chats
If different advisors are handling a different number of chats concurrently, an average number of concurrent chats may need to be calculated for scheduling purposes.
6. Abandon Rate
While this is useful to track in real time, gathering historical abandoned rates allows you to plot the percentage of abandoned calls against the time that customers have waited in the queue. This will help you to find out how long your customers are willing to wait for.
7. Pop-up Acceptance Rate
To test when and where the chat pops up, it is important to look back at historical data as to the acceptance rate of the pop-up when tested at different times and places on the site. This data helps you to make the decision.
Use Historical Data to Increase Revenue
Live chat has great value in terms of generating business through assisted sales, as opposed to unassisted, as Paul Weald proved, when working with a client.
Paul says: “We tracked when someone was browsing a website and placing a booking themselves. We called this ‘unassisted’ and compared conversion rates and spend versus those that went through a chat during the pre-sale process – ‘assisted’ customers.”
“To do this, we left a cookie on the browsers of permitting ‘assisted’ customers. Then, any booking that occurred within seven days for that user, we claimed that as an ‘assisted’ sale.”
“Not only was the average order value higher, what we found was that the conversion rate for an assisted live chat sale was much higher.”
By presenting live chat to management as a source of revenue, there is a chance that greater investment could be put into the channel – while it also helps to demonstrate the value of the contact centre.
This is one way to showcase the value of the contact centre. To find out more, read our article: 11 Ways to Secure More Budget for Your Contact Centre
Customer Metrics
To measure effectiveness across any channel, you need to be monitoring metrics that both monitor efficiency and quality. These customer metrics are very much based on the latter.
While it is obviously important to make sure that customers don’t have to wait too long in the queue, that is what real-time metrics and historical metrics are for. Customer metrics are those that analyse the quality of customer–advisor interactions.
It is these kinds of scores and feedback, especially if they’re positive, which should appear on an advisor dashboard, instead of or alongside handling times, abandon rates and so on.
As Paul says: “If you want to provide advisors with a personalised dashboard, incorporating the positive customer feedback and high rating scores that come through if you’re doing after-chat surveys can be great for building motivation.”
So, let’s take a look at these metrics, which can be fed through to advisors, but also, more importantly, to help ensure that customers are satisfied with the service that they receive.
1. Quality Scores
Quality scorecards are important to help track advisor performance and to find specific areas in which they need to improve. While other metrics are useful, quality scores are the only metric that can really help to pinpoint the areas for development.
2. Customer Satisfaction
While you could also measure loyalty, effort and emotion, Customer Satisfaction (CSat) remains the most important metric, according to our readers. It gives you the opportunity to benchmark performance across all channels – including live chat – unlike quality scores, as scorecards should be adapted from channel to channel.
3. First Contact Resolution
As well as any other channel: what percentage of chat interactions is resolved at the first contact? However, if an advisor moves the conversation from chat to another channel as part of the same interaction, this should still count as one contact.
Measure Repeat Contact Reasons as Well as First Contact Resolution
As discussed, if an advisor was to switch channels midway through an interaction, this should count as the same contact. This is because some channels are better for handling certain contact types than others.
Paul says: “I once did a piece of work with a utility company and they had a perception that the customer should be able to do anything on live chat that they could do on the phone.”
“But when I started doing an assessment, we suddenly found that there were many chats that were lasting more than an hour, yet they would have been a five-minute phone call.”
“So, once advisors were aware of the contact types that would last for a very long time, typically those that included the need for ID and verification, we gave them the ability to initiate callbacks. This helped to save us from wasting the customer’s time and consuming extra resources.”
This story highlights that it’s not always in the best interest of the customer to adhere to their live chat preference, but this preference must be respected.
So, assess your repeat contact reasons and their AHTs. For any contacts with AHTs that are much higher than the average, across all the contact types on the channel, consider giving advisors the ability to offer the customer a chance to move the contact onto another, better suited, channel.
Therefore, on live chat, it is best to assess repeat contacts and First Contact Resolution (FCR) separately, with the latter being important to assess the ability of advisors to resolve the customer’s query first time and avoid customers having to follow up.
Customer Surveys Work Well on Live Chat
To measure customer satisfaction, push a survey out as soon as the live chat has finished, perhaps by sending a link at the end of the interaction.
This survey can include the generic CSat question: “On a scale of 1–5, how satisfied were you with our service today?” to help create a trackable metric. This could also be done with a different question to measure FCR.
By pushing out a quick survey at the end of a chat, a company that Paul worked with received a 30% response rate, much higher than the company’s response rate on its voice and email channel.
Paul says: “This was because the customer is still on the website completing their transaction, which helped to provide immediate recognition and feedback.”
“An open comments box was also used in the survey, to help gather more feedback, which was passed through to the advisor – so that recognition really was instant. The feedback was generally 80–90% positive, so it helped to create a feel-good atmosphere.”
To find other ways of collecting more feedback, read our article: How to Get the Silent Majority to Respond to a Customer Survey
In Summary
Metrics across any contact centre channel should assess the real-time demand, the historical demand on the contact centre and, of course, what’s important to the customer.
On the live chat channel, this includes calculating the following list of metrics, which have been discussed in greater detail throughout this article:
- Service Level
- Number of Chats Queuing
- Number of Chats in Progress
- Status of Advisors / Advisor Availability
- Real-Time Abandon Rate
- Number of Elevations
- Chat Engagement
- Forecast Accuracy
- Number of Chats Handled
- Average Handling Time (across the channel and for repeat contact reasons)
- Average Number of Chats
- Abandon Rate
- Pop-up Acceptance Rate
- Quality Scores
- Customer Satisfaction
- First Contact Resolution
- Repeat Contact Reasons
However, there are other metrics that you can add to this list, such as Advisor Utilisation, Number of Transfers and the Net Promoter Score, depending on your business priorities.
Thanks to Paul Weald, Director at mcx, and Annette Miesbach, Sr. Product Marketing Manager at NICE inContact, for suggesting some of the metrics that were included in this list.
For more advice on using contact centre metrics, read our articles:
- Contact Centre Metrics: Are You Measuring the Right Things?
- What Are the Industry Standards for Call Centre Metrics?
- How to Build a Call Centre Quality Assurance Scorecard
Author: Charlie Mitchell
Reviewed by: Robyn Coppell
Published On: 17th Oct 2018 - Last modified: 22nd Jan 2026
Read more about - Call Centre Management, Annette Miesbach, Charlie Mitchell, Editor's Picks, Key Performance Indicators (KPIs), Live Chat, Management Strategies, Metrics, NiCE CXone, Paul Weald