The Largest Online Community for Contact Centre Professionals


The Largest Online Community for Contact Centre Professionals
 Close
Close




Published On: 24th Jan 2018 07:59 - Modified: 28th Sep 2026
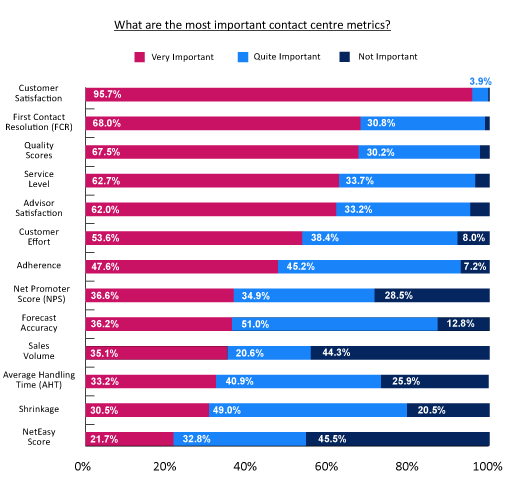
Here is our definitive top ten list of contact centre reporting metrics, chosen by you.
In our December 2017 report “What Contact Centres Are Doing Right Now – How Do You Compare?“, we asked over 380 contact centre professionals what they thought were the most important call centre reporting metrics.
You can find more on this topic in this article too – Top 10 Customer Experience (CX) KPIs (callcentrehelper.com)
By replying, they helped us create a top ten list of contact centre metrics, which we highlight below.
An old favourite that looks at the percentage of customers that are happy. This is generally simple and easy to operate, but no universally recognised approach exists for measuring Customer Satisfaction (CSat).
Contact centres can use a wide range of methods to carry out the survey. The most common are post-call IVR surveys and follow-up email surveys.
The survey would usually include a question such as: “How satisfied were you with our service today, on a scale of 1-10?”. The contact centre then calculates an average score from all responses.
Many new measures of customer success, loyalty and emotion have entered the industry. However, Customer Satisfaction remains a key part of the call centre metrics toolkit.
Why? Most likely because it helps to provide a great indication of customer intentions, lifetime value and customer churn, among other reasons.
For more on measuring CSat, read our article: How to Calculate Customer Satisfaction (CSat)
Also known as ‘Best Contact Resolution’, this is a common metric. It measures how many times a customer needs to contact a company before their problem is resolved. It also provides a useful way to measure the issue from the customer’s perspective.
The problem is that it is quite difficult to accurately measure and tends to be rather subjective. For example, a repeat call could be about a different problem.
Here are some common ways that contact centres measure First Contact Resolution (FCR):
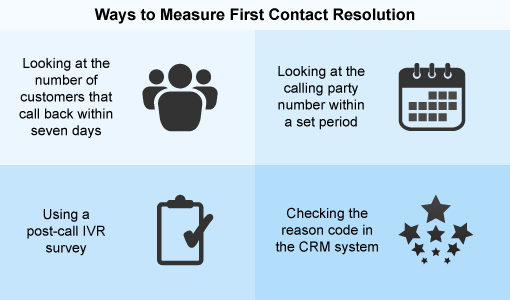
To reduce subjectivity, some contact centres are beginning to measure FCR across their most common contact reasons.
Each reason receives an individual score. This shows which call types result in the most call-backs, rather than relying on one overall contact centre score.
To find out more on measuring FCR, read our article: How to Calculate First Contact Resolution
Quality Scores measure advisor performance in most contact centres. They assess the overall caller experience by focusing on the conversations advisors have with customers.
Contact centres can use these scores to track overall performance, but they more commonly use them to assess individual advisors.
This allows the contact centre to single out advisors and teams that may need more coaching time or, conversely, highlight those who deserve a reward.
Typically, a contact centre would have a “quality team” that will listen to the recordings of five or six calls per advisor every month.
They would then fill in a scorecard, ticking boxes to indicate whether the advisor was able to do things like greet the customer kindly, show empathy and so on.
An average quality score can then be calculated for an advisor each month. However, as some of the criteria are subjective, it is important to hold quality calibration sessions to remove any suggestions of bias from the team.
Find out how to boost these scores by reading our article: 10 Top Tips to Improve Your Quality Scores
ACD systems produced this as one of their first metrics. It measures the percentage of calls answered within a given time.
The average figure seems to be between 80% of calls answered in 20 seconds and 95% of calls answered within 15 seconds.
Pleasingly, this was the only efficiency-based metric to make the top ten, with the others being based on quality and outcomes.
However, this still made the list, most likely because of its importance when working out how many advisors are needed in the contact centre at any given time to lower queue times for customers.
Just remember, advisors should not be pressured to rush through calls just to meet service level, it is best used as an operational metric, not as a quality measurement.
This is a measure of the contact centre team’s happiness, which, like CSat, can be measured in many different ways.
While many contact centres choose to simply conduct an end-of-year survey, it is now becoming more commonplace to measure Advisor Satisfaction more frequently.

Calculating a Quarterly Employee Net Promoter Score (ENPS) is a good alternative. Or the contact centre could instead simply ask advisors a question such as: “On a scale of 1-10, how happy are you at work?”, every three or four months, and track the change to the average score of the entire contact centre.
This can provide great insight into the change in engagement of the team, while having different surveys at different key stages of the advisor lifecycle can also be a good idea. These stages may include:
For more on this topic, read our article: How Do I… Measure Employee Engagement?
Customer Effort is usually tracked through calculating a Customer Effort Score (CES), which is again measured through customer surveys.
Ordinarily a question would be put to the customer along the lines of: “How much effort did you personally have to put forth to handle your request, on a scale of 1-5?”
On this scale, 1 would mean that it was an interaction of low effort and 5 would indicate that it required a lot of effort on the customer’s part.
The average scores are then tallied, which would be somewhere between 1-5, with the lower the number, the better the result.
In 2016, only 37.6% of those surveyed believed that Customer Effort was a very important metric, which highlights the metric’s growing popularity. This rise could be due to research suggesting that effort has a greater impact on customer loyalty than delighting customers.
For more on measuring a CES, read our article: How to Calculate Customer Effort
Adherence is a metric that calculates a percentage figure for the amount of time an advisor spends working compared to their schedule – whether that’s on the phone, completing after-call work (ACW) or any other scheduled activities.
For example, if an advisor is scheduled to take calls from 3pm to 4pm, but was five minutes late and takes calls from 3:05pm-4:05pm, they were only at work for 55 of their scheduled 60 minutes. This means that the advisor’s adherence percentage would only be 91.6%, as highlighted below.

This metric is often confused with others, including conformance, occupancy and utilisation, but it is used widely in call centres, as the industry is often the victim of high levels of absenteeism.
Similarly to Quality Scores, this metric is often calculated at an individual advisor level as well as across the whole contact centre.
For a complete rundown, read our story: How Do I Calculate… Schedule Adherence?
Given the amount of hype that the Net Promoter Score (NPS) has generated, it is surprising to see this so low down the list. It looks at the number of people who would recommend the product or service to their family or friends.
This metric has had a huge amount of airplay in the past few years and has been promoted as the one metric that can be used to predict customer loyalty. In many ways it is similar to Customer Satisfaction, but it tends to take a more binary approach to measurement.
This binary approach involves calculating the percentage of business promoters which lie within the customer base, by asking them: “On a scale of 1-10, how likely are you to recommend our product/service to a friend?”
Yet it seems that this metric is not as popular as it once was. For many companies who have used it, after some good initial results, they have seen their results level off. It is also influenced quite highly by factors outside the contact centre – for example, pricing policy, news in the press and overall branding.
Find out how to measure an NPS in full by reading our article: How to Calculate… Net Promoter Score
This is a favourite among workforce planners who look at the accuracy of their overall forecasts, as they try to figure out how they can improve their future results.
Most do this by finding the percentage difference between actual volume and the forecast volume expressed as a percentage.
So, if a contact centre was forecast to handle 90 calls in a half-hour period but it actually received 100 calls, the forecast was off by a factor of 10%.
When we looked at this metric in a recent report, we found that most contact centres have a forecast accuracy of better than 10%, as highlighted below.
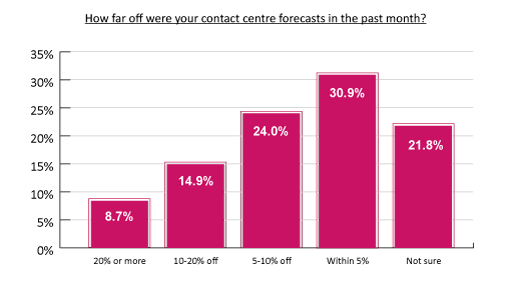
However, while this all may seem well and good, forecasts can often be wildly inaccurate. The problem is, as one resource planner told us, “Our forecasts are normally quite accurate most of the time, but when they go off, they tend to go way off.”
This is because forecast accuracy is highly influenced by external factors such as the weather, marketing and the post, which can result in unexpected peaks in contact volumes.
For more on measuring forecast accuracy, read our article: How to Calculate Forecast Accuracy
Sales volume is the number of sales that an advisor or a contact centre makes over the course of a certain time period or per X number of contacts.
While this is simple to calculate, sales volume in the contact centre is usually measured in terms of:
While this is no doubt a crucial metric for sales-based contact centres, to assess both performance and lead quality, it has no real use to many of those surveyed, who are instead likely to be from customer-service-based contact centres.
In a surprise result, only 33.2% of call centre professionals view Average Handling Time (AHT) as a “very important” metric.
While, like Service Level, it is still important when using an Erlang Calculator to work out the number of staff needed in the contact centre, the result could reflect changing attitudes towards the use of the metric as an advisor target.
This is because many have cast their doubts over whether doing so is in the best interest of the customer, as advisors start to rush through their calls to avoid missing their objectives. We discuss this further in our article: Want to Increase Customer Satisfaction? Stop Measuring Average Handling Time!
Other results showed that most contact centre professionals don’t view Shrinkage and NetEasy as key metrics. These findings are highlighted below:
Originally published in July 2012. Recently updated.
For more great insights into contact centre metrics, read our article:

A selection of articles from contact centre industry experts.
Read more by Charlie MitchellReviewed by: Robyn Coppell

The Latest Customer Contact Research, Reports and White Papers straight to your inbox!
Get the latest insights from Call Centre Helper by signing up for our email content.
Close


14th October 2026
14th October 2026
How to Keep Humans in the Loop Without Slowing AutoQA Down – Webinar