


How long are customers really willing to wait on hold before frustration kicks in? The Average Speed of Answer (ASA) is a key metric that helps contact centres measure and manage this crucial aspect of service delivery.
In this article, we explore how ASA is calculated, what affects it, and how it connects to customer satisfaction.
What is Average Speed of Answer?
Average Speed of Answer is a metric calculating the amount of time it takes to answer a typical call once it has been routed to the contact centre. It is often used with the metric of Average Wait Time (AWT), the period of time before being connected to an advisor.
ASA is often a key part of a contact centre’s Service Level Agreement (SLA), represented as a guarantee to answer a certain volume of total calls within an agreed amount of time. 28 seconds is the global average for ASA, and the 80/20 rule – 80% of calls answered within 20 seconds – is often cited.
In reality, there is so much variety between different centres that there are few widely applicable rules. Research has also shown that customers will tolerate different waiting times for different kinds of service.
For example, customers calling technical assistance lines will wait longer for service than customers calling conventional service lines.
Looking for more information on service level, read our article: What Is an Acceptable Contact Centre Waiting Time?
The Formula to Calculate Average Speed of Answer (ASA)
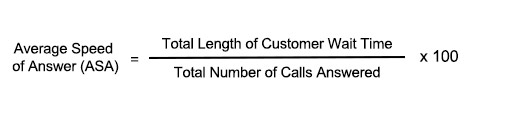
To calculate average speed of answer you need to first divide the total length of customer wait time by the total number of call answered, then multiply this by 100.
This is shown in the ASA formula below:
Average Speed of Answer = (Total Length of Customer Wait Time ÷ Total Number of Calls Answered) x100
Average Speed of Answer and Customer Satisfaction
Customer Satisfaction (CSAT) is a metric often associated with ASA, as time spent queueing is one of the main factors affecting how customers judge the level of service.
The relationship is not binary, however, and low waiting times do not automatically indicate high CSAT. This is, in part, due to how ASA is calculated. The metric is understood from the contact centre’s perspective, starting from when the customer is placed in a queue after they have navigated IVR.
Long or confusing IVR processes can make a customer’s experience both irritating and much more drawn out than the ASA figures would indicate.
Another factor that affects answer speed data is the call abandon rate. If a customer ends the call before they are connected to an agent, their call does not count toward the ASA figure. At the same time, the factor most likely to lead to a customer abandoning a call is a prolonged wait.
The result is that the worst offenders, in terms of answer speed, are often discounted from the understanding of average answer speed.
Want to know more about wait time and CSAT, read our article: Is There a Correlation Between Queue Time and Customer Satisfaction Levels?
Observe the Average Speed of Outliers
The figures can also be distorted by the process of averaging. For example, a contact centre may be open for ten hours a day, adhering to their target ASA of 20 seconds.
However, a closer look at performance hour-on-hour reveals a regular slot – the lunch hour – where a combination of increased traffic and poor scheduling means customers queue for 2 minutes.
This raises the average, but not beyond the centre’s SLA, because throughout the rest of the day, answer times are around 10 seconds.
The contact centre is technically on target, but for 10% of the day customers face comparatively long waits. This could potentially do enormous damage to CSAT.
Hour-to-hour averaging reports can mitigate this, as well as a study of call abandon rates for periods of peak traffic. Perspective can also be gained by studying the range of waiting times – the longest and shortest times customers were asked to wait.
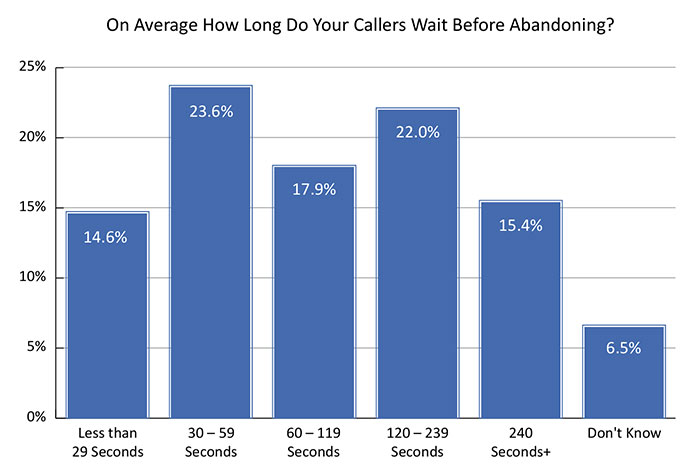
Our 2024 survey ‘What Contact Centres Are Doing Right Now‘ found that customer patience appears to be at an all time low, with 38% of contact centres reporting that most of their customers will abandon if they’re left in the call queue for only one minute.
If you want to learn a method for predicting call abandon rates, read this article: How to Predict Call Abandon Rates Based on Service Level
What Are the Classic Waiting Times for Different Contact Centre Channels?
According to Call Centre Helper’s 2019 report: “Is Your Contact Centre Delivering Exceptional Customer Service?“, the average wait times set across the entire industry are as follows:
- Phone – The most common practice is to answer 80% of calls within 20 seconds
- Email – The most common practice is to answer 100% of queries within 4 hours
- Live Chat – The most common practice is to answer 80% of queries within 20 seconds
- Social Media – The most common practice is to answer 100% of queries within 60 minutes
But these are only averages. What is best for your customers is a whole different matter.
For more great information on call wait times and average speed to answer, read these articles next:
- Waiting Time: What Is Best for Your Customers?
- How Do I… Reduce Call Queuing Time?
- Omnichannel – What Is an Acceptable Waiting Time?
Author: Jonty Pearce
Reviewed by: Hannah Swankie
Published On: 19th Aug 2016 - Last modified: 21st Jan 2026
Read more about - Definitions, Average Speed of Answer (ASA), Customer Satisfaction (CSAT), Metrics, Service Level, Terminology