Customer Experience (CX) has emerged as a key driver for the success of any organization. Companies are realizing that delivering good Customer Experience throughout the customer journey is a key differentiator and a powerful way to build long-term relationships.
Top Ten Customer Experience KPIs
Here are the top 10 Customer Experience KPIs, as voted on by over 200 contact centre professionals in Call Centre Helper’s ‘What Contact Centre Are Doing Right Now’ research.
1. Customer Satisfaction Score (CSAT)
The Customer Satisfaction Score (CSAT) is a KPI that directly measures customer satisfaction with specific interactions or experiences. Typically obtained through post-interaction surveys – or other great methods – CSAT allows customers to rate their satisfaction on a numerical or Likert scale.
By tracking CSAT scores, contact centres can identify pain points, monitor trends, and take targeted actions to enhance customer satisfaction. CSAT provides actionable insights into customer sentiments and helps drive continuous improvements.
There are lots of ways in which organizations can improve their CSAT Scores, as Paul Weald, The Contact Centre Innovator, explains:
- Define the Right Culture – Based on a clear customer-orientated vision that you can communicate with your staff.
- Create an Emotional Connection – Recognize customer differences and remember: “It not what you say, it is how you say it.
- Use Customer-Orientated Measures – To benchmark the impact of the customer experience improvements that you make.
Don’t know where to start? You can find out How to Calculate a Customer Satisfaction Score (CSAT) in this article.
2. Service Level
Service Level is a critical KPI that measures the percentage of calls answered by contact centre agents within a specified timeframe. For example, a common Service Level target might be to answer 80% of calls within 20 seconds, or 100% of emails within 4 hours.
Monitoring Service Level helps assess the efficiency and responsiveness of the contact centre, ensuring customers are not left waiting for extended periods.
3. Quality Scores
As part of an excellent QA programme, Quality Scores gauge the performance and effectiveness of contact centre agents in delivering excellent customer experiences. These scores are typically derived from evaluations of call recordings, email interactions, or chat transcripts.
Quality teams rate agents based on predefined criteria, such as adherence to scripts, problem-solving skills, empathy, and overall customer satisfaction. By creating the ideal scorecard and monitoring Quality Scores, contact centres can identify areas for improvement, provide targeted coaching, and enhance agent performance.
4. Call Abandon Rate
Call Abandon Rate measures the percentage of callers who disconnect before reaching an agent. A high abandon rate indicates potential issues in customer service, such as long wait times or inadequate routing strategies.
Measuring this KPI and taking simple steps to reduce abandon rates helps contact centres optimize staffing levels, refine call routing algorithms, and minimize customer frustration caused by lengthy wait times.
5. First Contact Resolution (FCR)
First Contact Resolution (FCR) measures the ability of customer support and service teams to resolve customer enquiries or issues in the initial interaction.
It focuses on addressing customer needs promptly and effectively without the need for additional follow-up contacts – which can prove costly and time-consuming, particularly if the customer is having to start over with a different agent each time.
Achieving a high FCR rate is crucial for customer satisfaction and operational efficiency. By tracking FCR and taking steps to improve it, businesses can identify areas where improvements are needed, enhance training and knowledge management, and ensure a seamless resolution process – as Dick Bourke, Co-Founder of Scorebuddy explains:
“Customers want companies to take care of their needs quickly. In fact, 40% of customers want agents to take care of their needs faster, and they do NOT want to have to repeat themselves to multiple support agents.
And that only scrapes the surface of the importance of first contact resolution customer service. Companies that continually measure first call resolution outperform their competitors in many areas.
According to The Ascent Group, by measuring FCR for a year or more, you can improve your performance by up to 30%.”
6. Customer Complaint Volumes
Tracking Customer Complaint Volumes provides valuable insights into overall customer experience (CS) and satisfaction (CSAT).
By monitoring and categorizing complaints, contact centres can identify recurring issues, pinpoint areas for process improvement, and proactively address customer pain points – all to help drive down customer complaints.
Additionally, analysing complaint trends enables contact centres to implement preventive measures to reduce future complaints, fostering long-term customer loyalty as well as reducing call volumes.
Want to get started? Here are some Top Tips for Dealing With Customer Complaints in Call Centres.
7. Customer Effort Score (CES)
Calculating the Customer Effort Score (CES) helps contact centres measure the level of effort customers need to exert to achieve their goals when interacting with a company. It assesses how easy or difficult it is for customers to navigate processes, find information, or resolve issues.
CES surveys typically involve questions like “How much effort did you have to put into resolving your issue?” or “How easy was it to find the information you were seeking?”.
Tracking CES helps organizations identify areas of friction and streamline processes for a smoother customer journey, all helping to support greater customer satisfaction and loyalty.
8. Net Promoter Score (NPS)
Net Promoter Score (NPS) is a widely used KPI that assesses customer loyalty and advocacy – by measuring the likelihood of customers recommending a brand to others.

NPS is calculated by asking customers a simple question: “On a scale of 0-10, how likely are you to recommend our company/product/service to a friend or colleague?” Based on their responses, customers are classified as promoters (9-10), passives (7-8), or detractors (0-6).
By tracking their NPS, businesses can gauge overall customer satisfaction and identify potential brand advocates or areas requiring improvement. This has fallen out of popularity in recent years, as it focusses more on the perception of the company, rather than the most recent customer experience.
9. Customer Lifetime Value (CLV)
Customer Lifetime Value (CLV) represents the total value a customer brings to a company over their entire relationship. It considers revenue generated from repeat purchases, upsells, cross-sells, and referrals.
By tracking and calculating CLV, businesses can see the financial impact of their CX efforts and make informed decisions on resource allocation. Better understanding CLV also empowers organizations to be more proactive in prioritizing high-value customers and building mutually beneficial relationships.
Tracking CLV can also help to emphasize the importance of a robust customer retention strategy to the senior leadership team.
10. Customer Retention Rate (CRR)
Customer Retention Rate (CRR) measures the percentage of customers who continue to do business with a company over a specific period. A high CRR indicates customer loyalty and satisfaction.
By monitoring CRR and implementing customer retention strategies, businesses gain insights into the effectiveness of their CX and identify areas for improvement. Retaining existing customers is often more cost-effective than acquiring new ones, making CRR a vital KPI for long-term success.
Want to get started? Here are some Top Tips for Customer Retention.
Contact Centre Metrics
These Customer Experience KPIs are a subset of contact centre KPIs, but are the ones that focus more on the customer experience and outcomes – rather than on efficiency.
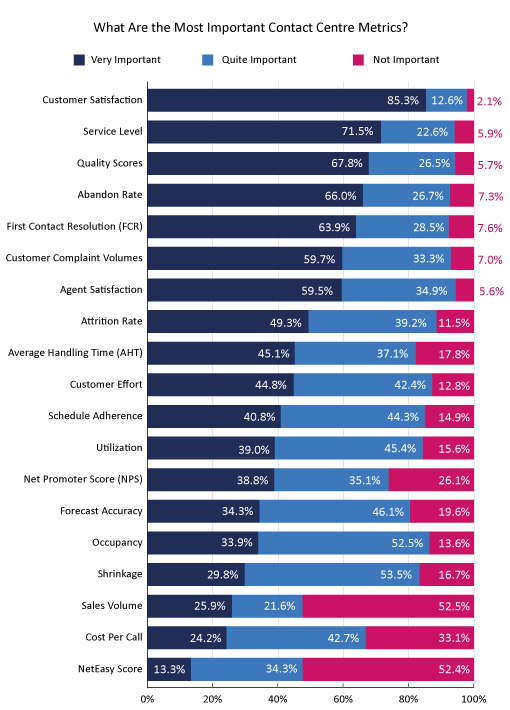
These contact centre KPIs are taken from our survey What Are Contact Centres Doing Right Now – 2022 Edition.
Why Was Average Handling Time (AHT) Not Included?
You may have noticed that Average Handling Time (AHT) didn’t make the list in our Top 10 Customer Experience (CX) KPIs. Here’s why…
Average Handling Time (AHT) is a metric that measures the average time it takes for a customer service agent to handle a customer interaction, including the time spent on call or chat.
While AHT is traditionally used as a performance indicator for efficiency and productivity, relying solely on this metric can have drawbacks when it comes to assessing the overall customer experience.
Here are some reasons why AHT should be used with caution:
Sacrificing Quality for Speed
Placing excessive focus on reducing AHT may encourage agents to rush through interactions, potentially compromising the quality of customer service. Aiming to handle customer enquiries quickly might lead to incomplete or inadequate resolutions, leaving customers dissatisfied.
Ignoring Complexity and Context
AHT fails to consider the complexity of customer issues and the context in which they arise.
Some customer enquiries may require more time to resolve due to technical difficulties, complicated concerns, or the need for thorough investigation.
Evaluating agents solely based on AHT disregards the unique circumstances of each interaction.
Limited Focus on Customer Satisfaction
AHT prioritizes speed over customer satisfaction. While it is important to provide an efficient service, the ultimate goal is to deliver a positive experience that meets or exceeds customer expectations.
Relying solely on AHT may neglect crucial aspects of the customer journey that contribute to overall satisfaction, such as empathy, personalized interactions, and effective problem-solving.
Encouraging Escalations and Callbacks
By pressuring agents to minimize AHT, there is a risk of unresolved or partially resolved issues. This can result in customers having to reach out again or requiring escalation to higher-level support, which increases customer effort, impacts FCR scores, and negatively impacts the overall CX.
While AHT can be used as a supporting metric for operational efficiency and resource planning, it should not be the sole focus when assessing customer experience. Instead, organizations should prioritize metrics like customer satisfaction scores, first contact resolution, and quality scores.
Overall, please remember that CX is an ongoing journey, and no single KPI will tell the complete picture.
For more information on Customer Experience (CX), you should read these next:
- How to Improve the Customer Experience – With a Checklist
- Customer Experience in Contact Centres: Survey Results
- 28 Effective Ways to Build Rapport With Customers and Clients
- The Top 10 Most Important Call Centre Metrics
Author: Megan Jones
Reviewed by: Jonty Pearce
Published On: 26th Jul 2023 - Last modified: 22nd Oct 2025
Read more about - Customer Service Strategy, Abandoned Calls, Average Handling Time (AHT), Complaints, Customer Effort, Customer Experience (CX), Customer Satisfaction (CSAT), Dick Bourke, First Contact Resolution (FCR), Key Performance Indicators (KPIs), Metrics, Net Promoter Score (NPS), Paul Weald, Quality, Retention, Service Level, Service Strategy


